
Whiteboard Guide
This article is a guide through all the functions on the whiteboard.
📘 Instructions
Create a Whiteboard

Select the “+” button at the bottom of the screen
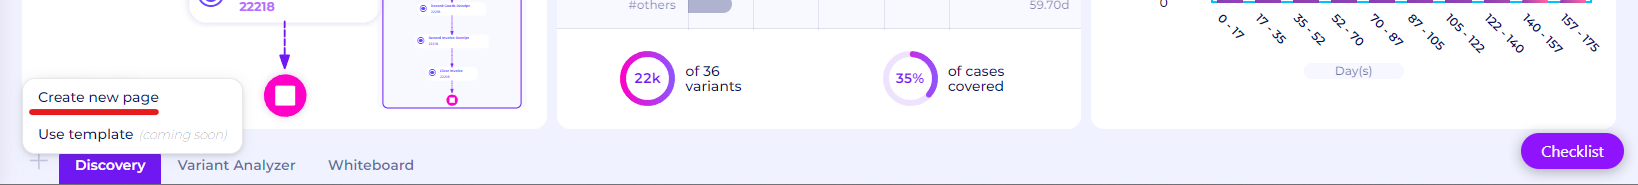
Select Create new page

Select Whiteboard

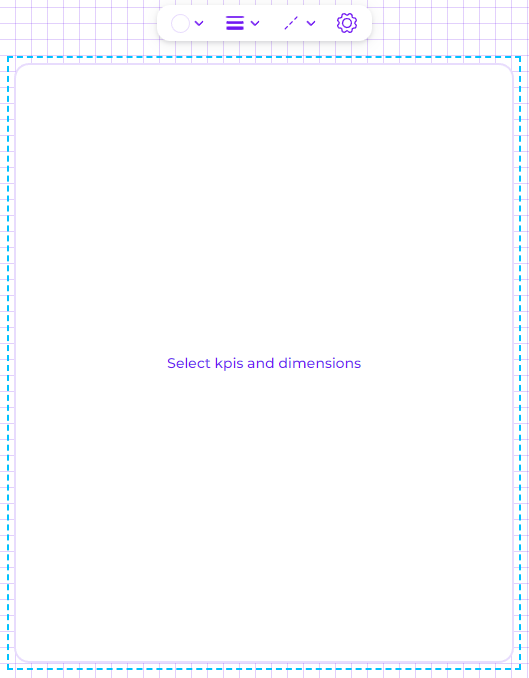
Once the whiteboard has loaded press the Edit Icon as highlighted in the image
The Buttons

From left to right
Cursor
Must be selected to move and select any elements on the whiteboard
Eraser
Click on elements in the whiteboard to remove it
Lines
User can select a line with or without an arrow and draw it on the whiteboard
Widget Menu
Where users can drag and drop widgets such as charts and tables into the whiteboard
Text
Users can input a text box and text can be edited by highlighting the text while the cursor is selected
Shapes
Users can select a shape to draw
Enable/Disable Gridlines
Magnification
Save
There is autosave but users should remind themselves to save their work periodically
Enable/Disable Editing
Share
Widgets
To configure a widget
Open the widget menu

Drag and drop a widget e.g. a pie chart
Select the chart with the cursor
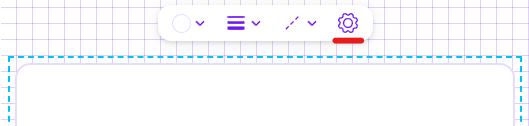
Select the settings icon to configure the chart
Building a Dashboard
With the tools above build a simple dashboard that can tell a bit more about the dataset.
Number of cases
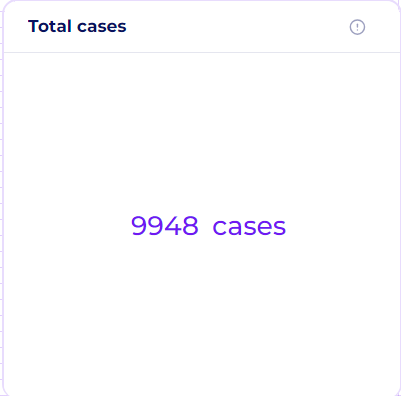
Starting with a simple question - how big is the dataset?
To see the above figure:
Open the widgets menu
Drag the statistics widget onto the whiteboards
Select a KPI for the widget and configure the title and unit
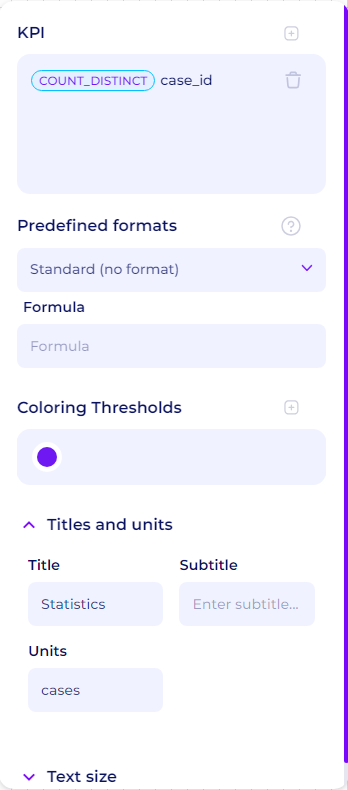
For KPIs click the plus icon next to the box to configure
Table
What if we want to see multiple summary statistics at once? Then we use a table
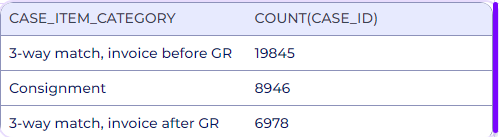
To achieve this:
Open the widget menu
drag the simple data table into the whiteboard
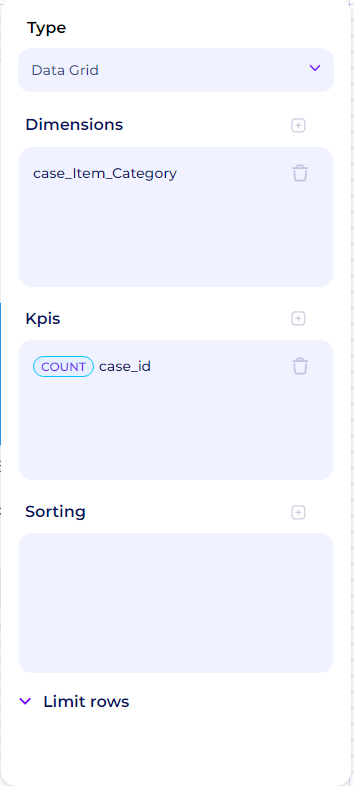
Bar chart
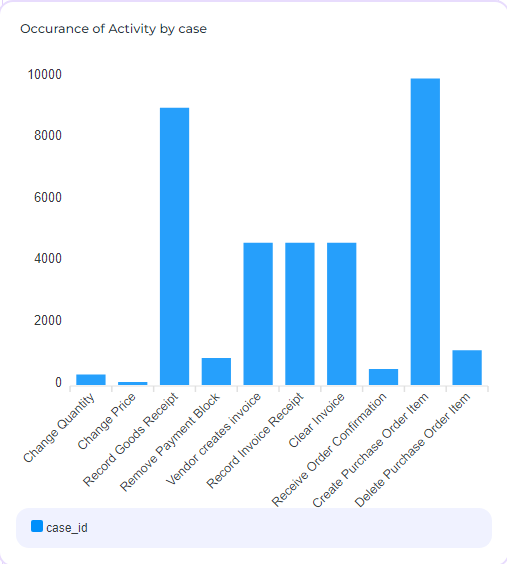
Lets see what are the most common activities
To do this:
Drag the Bar chart widget from the menu onto the whiteboard
Configure the bar chart
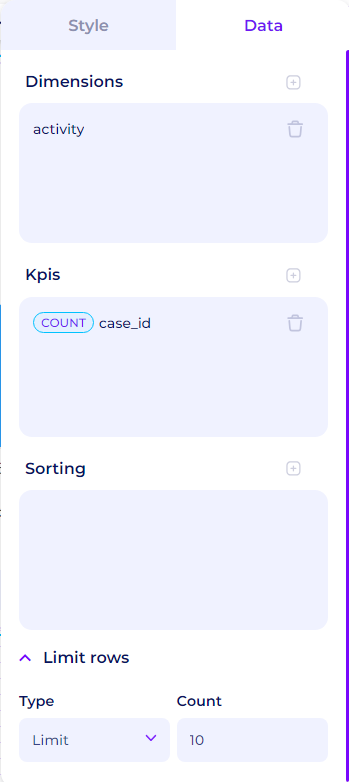
Always check the limit rows section and adjust the value accordingly. If the widget appears to be missing information this might be why.