
Road Traffic Management Process Demo
Introduction
Organizations are increasingly focusing on business processes as technology and enterprise systems develop. Understanding and managing these processes is critical to business efficiency and competitiveness, ensuring companies continuously deliver value.
These business processes are often supported by an integrated enterprise system that records each activity in an event log. Each event in the log can include several attributes such as the timestamp, who performed the activity, what activity was being performed, which cases were affected, and other data that the system can capture.
If analyzed properly, these data points provide valuable insights to let managers and leaders make data-driven decisions.
All businesses have their ideal processes for sales, operations, and other aspects. However, in reality, these processes often deviate from this ideal. Perceptif analyzes such data in real-time, identifying the variances, and presenting the reality.
Now, let’s show you how Perceptif assists companies in gaining valuable insights from your raw event log data by providing real-world examples from a public organization.
About Dataset
Dataset Format
Event data is commonly stored in tables, CSV files (Comma Separated Values), and spreadsheets (like Excel files), where each row or column represents an event. For process analysis using Perceptif, there are 3 main attributes required in your data:
Case Id: Unique identifier of each case in a process.
Events: An activity completed in a single case Id. Each can have multiple Events.
Timestamps: When activity is performed in the system. Event log data can have 2 timestamps - a start (when an event begins) and an end (when it's completed).
Other optional attributes such as case attributes and resources can also help describe the business process.
Dataset Source
The sample data is a real-life event log of an information system managing road traffic fines, provided by the local police of an Italian city. The data illustrates the management and handling of road traffic fines by a local police force in Italy. The system records sufficient data to create an event log. Download the modified datasets that will be used in this demonstration here.
Public service organizations are typically not profit-oriented. However, they are required to operate at the same level as any other profit-oriented companies, especially organizations that collect money from the public (such as tax agencies and fine management). This is important because taxes and other similar sources of income are essential for a country to operate
From the organization’s perspective, bureaucracy, and politics often make it difficult for them to focus on their business processes and actively monitor them. At the same time, these organizations are usually bound by law to operate as efficiently as possible (for example, ensuring that all taxes and fines are collected accordingly). It is also in the interest of the organization since its budget is usually correlated with its overall performance. Therefore, constant monitoring and improvement of their business processes are necessary as part of good governance and compliance with the law.
Dataset Attributes
Below is a description of the many data attributes for our analysis.
Attributes | Description |
case_id | Case identifiers |
activity | The name of activities done in a case_id |
timestamp | The timestamp when activity was started |
amount | The amount that needs to be paid by the offender |
points | The number of points that are deducted from the offender’s license |
paymentAmount | Total amount that has been paid by the offender |
dismissal | Contains a character that encodes the diverse reasons for a possible dismissal of the fine. A value of NIL encodes that the fine is not dismissed (i.e. has to be paid); any other value encodes different motivations. |
article | Unclear, but the assumption is the Law id that the offenders break |
expense | The post tariffs expense for sending notification to offenders |
vehicleClass | The type of the vehicle that the offenders use |
resources | Unclear, but the assumption is the Id of the officer responsible for each cases |
Main Questions
The dataset is from local city police in Italy. The main obligation of the organization is of course to protect the community, including those related to traffic violations. Even though it is not a profit organization, the police still have to ensure that traffic violations are followed up in accordance with applicable regulations, especially concerning fines. The number of fines that are successfully obtained will be a source of state revenue
However, the police felt like their road traffic fine management process is still run inefficiently. They feel like not enough fine is collected compared to the number of traffic violations, even though the whole system has been run with a digital database. They want to take a look at what actually happening with their process and see if there’s anything that could be improved upon later
The police seek answers to these questions:
What's the actual process?
How many cases ended up with offenders paying the fine and how many cases ended up in credit collection agencies?
Is there anything that can be improved upon?
Possible Scenarios of the Road Traffic Fine Process
According to domain experts, the process normally operates as follows:
A fine is created (Create Fine). The fine is sent to the offender’s place of residence (Send Fine). When the offender receives the fine, the date of reception of such notification is also registered (Insert Fine Notification). The offender has 60 days to either pay the fine (Payment) or appeal against it. After this period, a penalty is added to the fine amount (Add Penalty). The payment itself can be made in one or more installments, depending on the amount of the fine.
If an appeal is initiated within 60 days, it is sent to the corresponding prefecture (Send Appeal to Prefecture) and registered when received (Insert Date Appeal to Prefecture). The results of the appeal are sent back to the municipality (Receive Result Appeal from Prefecture) and notified to the offender (Notify Result Appeal to Offender), which can appeal against the result (Appeal to Judge). If the offender does not pay (possibly after a denied appeal), the case is sent to an external credit collection agency that will contact the offender to collect the payment (Send for Credit Collection). The part of the process after the fine is sent out for credit collection is not captured in the event log.
Exception: parking tickets can be paid immediately, after the ticket creation (in which case the paperwork is bypassed and unnecessary administration costs are avoided).
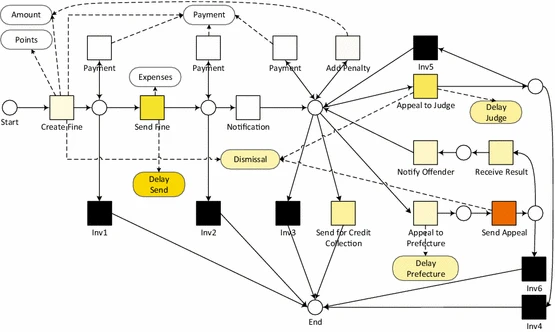
Figure 1. Process model from Balanced multi-perspective checking of process conformance | SpringerLink
Currently, the organization recognizes a few possible scenarios on how the process went on.
The Most Desirable Scenario
The most desirable scenario is obviously where offenders pay their fines fully. It is also important to see how quickly the violator pays the fine. The longer the fine is paid, the police must send a violation notification to the offender, where the police must pay the postal rate in advance. Therefore there are several possible scenarios. Here’s a list of desirable scenarios from the process.
The fine is paid on the spot, without having to send a notification to offenders
Create Fine → Payment
The fine is paid after the notification is sent to the offenders
Create Fine → Send Fine → Insert fine notification → Payment
Another possible scenario is where the fine is paid after notification is sent and a penalty was added. This means that the offenders didn’t pay the fine within 60 days after the original violations. Even though payment is received, this scenario is less desirable than the previous one because of the long duration of the case.
The fine is paid after notification and a penalty was added
Create Fine → Send Fine → Insert fine notification → Add penalty → Payment
The Least Desirable Scenario
The least desirable scenario is where offenders didn’t pay the fine, even after notification and a penalty. In this case, the fine is sent to a credit collection agency. This process is not recorded in the data. This means that the fines aren’t directly collected by the police, and could lead to a loss of “revenue“.
The fine is sent to the credit collection agency
Create Fine → Send Fine → Insert fine notification → Add penalty → Send for credit collection
Other scenarios, such as payment in installments, appeal to the prefecture
Appeal to prefecture and payment
Create Fine → Send Fine → Insert fine notification → Send appeal to prefectures → Insert Date Appeal to Prefecture → Receive Result Appeal from Prefecture → Notify Result Appeal to Offender → Payment
Appeal to prefecture and then judge, and payment
Create Fine → Send Fine → Insert fine notification → Send appeal to prefectures → Insert Date Appeal to Prefecture → Receive Result Appeal from Prefecture → Notify Result Appeal to Offender → Appeal to judge → Payment
The data context can be better understood now, which is useful for our analysis later.
Process Discovery
After uploading, Perceptif automatically detects all possible flows in the data. These flows are called Variants. There are 3 main windows to view, as below:
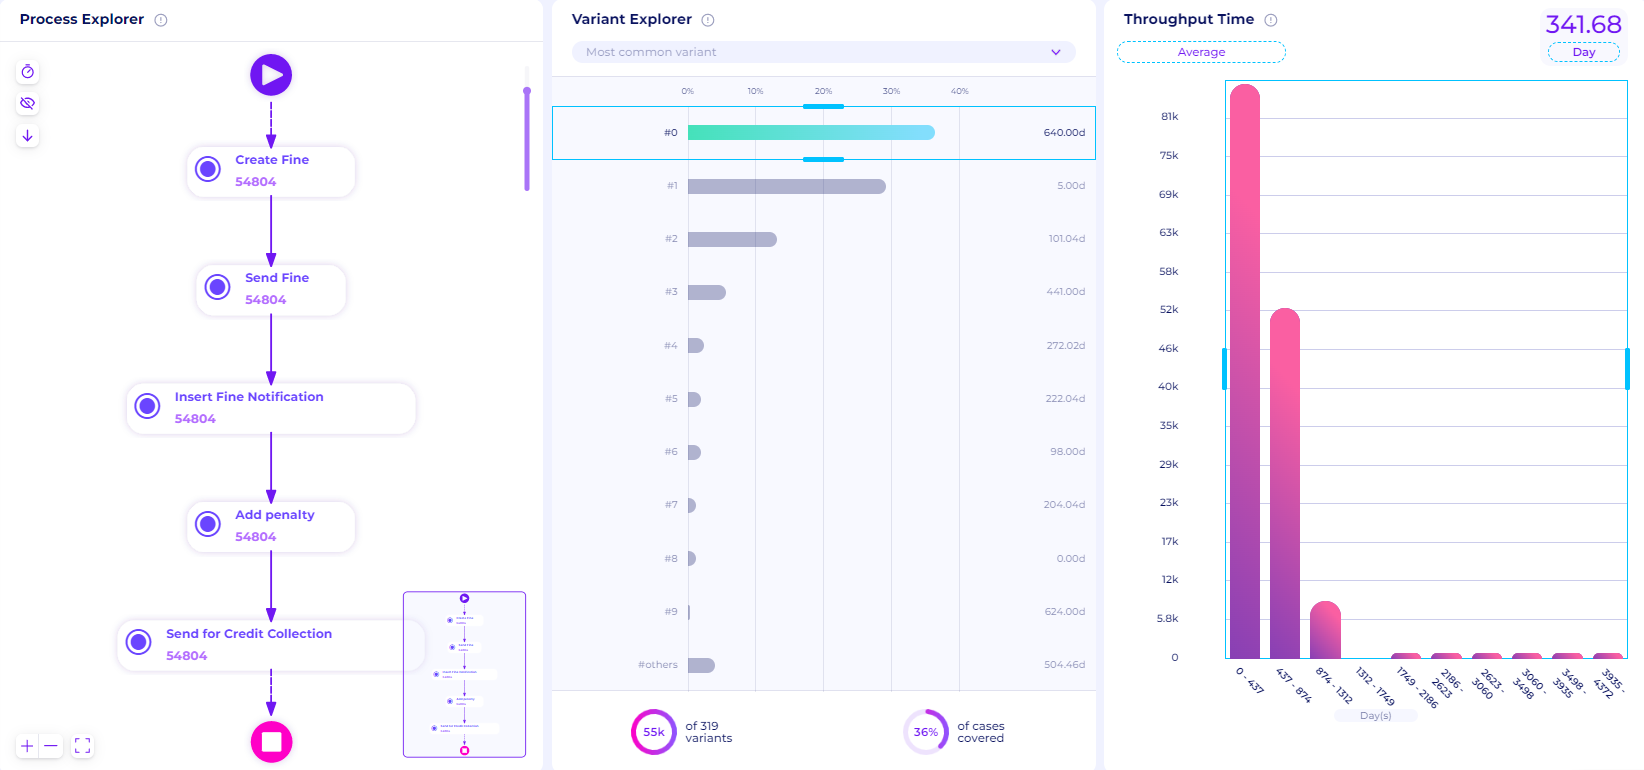
Figure 2. Main Page of the process discovery
On the left is Process Explorer, this window displays process maps of variants selected in the middle window.
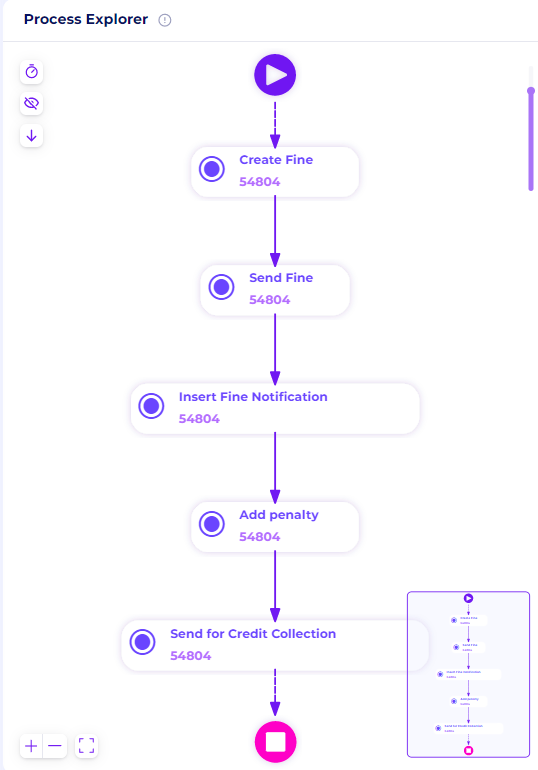
Figure 3. Process Explorer Window
In the middle is Variant Explorer, a window that shows the list of process paths in order of most to least common.
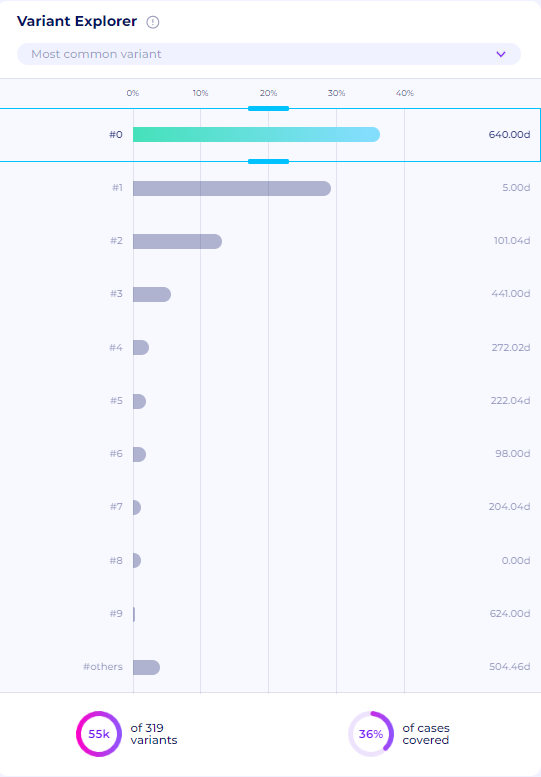
Figure 4. Variant Explorer Window
On the right window is Throughput Time, a graph that shows the case duration in data.
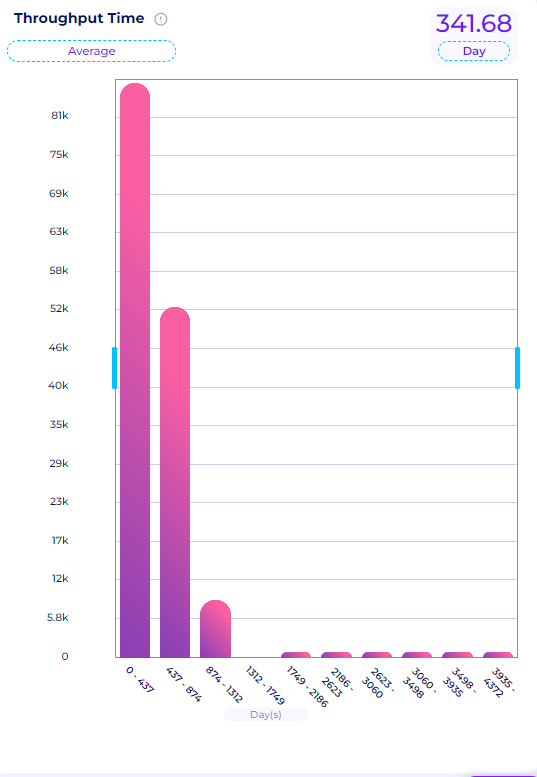
Figure 5. Throughput Time Window
Variants In The Data
Perceptif automatically detects all the process paths within the data; we call these Variants. Ideally, businesses want processes to have minimal variants to minimize deviation and increase efficiency. In reality, processes can have hundreds of paths and variations. The various variants can indicate uncontrolled processes, fraud, and/or inefficiency.

Figure 6. The number of variants
Based on Figure 6 in the Variant Explorer, we can see that there are 319 variants here.
This shows that there are multiple process flow variations in this dataset. We will analyze this further later. Now, let’s check three of the most common variants. To do that, use the slider in the Variant Explorer. By default, it shows the most common variants.
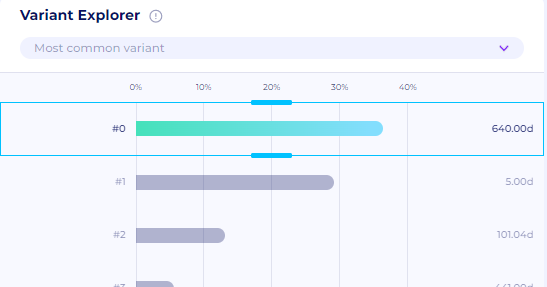
Figure 7. Use Slider to select the most common variants
Variant #0
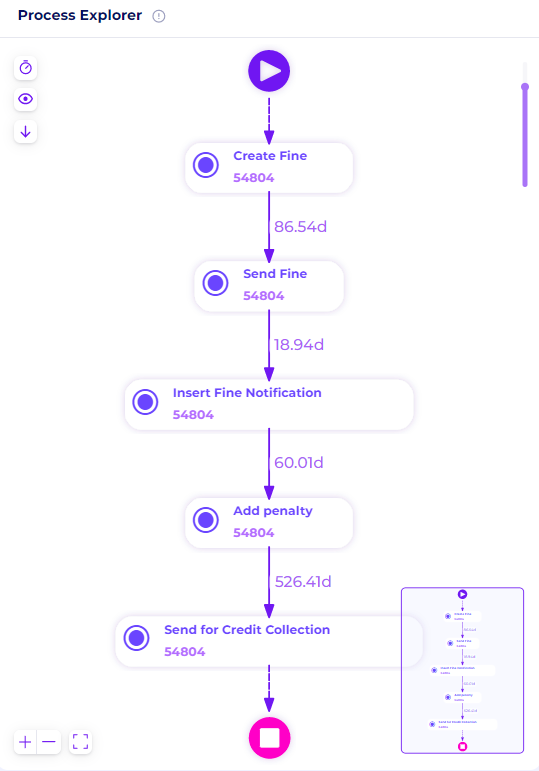
Figure 8. The Process Flow of Variant #0
The process map in Figure 8 shows the path of the most common variant. This variant has 5 activities and 54,804 cases. This is the variant where the offenders do not pay the fine after 60 days, thus another penalty is added to the offenders. The offenders didn’t pay the fine, and the case is sent to the credit collection agency. This is the variant that is the least desirable since the offenders didn’t pay the fine, and instead, the fine is sent to the credit collection agency (black box) which means a loss of revenue (from the perspective of the police institution). However, this is the variant with the most cases. Thus we can conclude that the business process still needs a lot of improvement
Variant #1
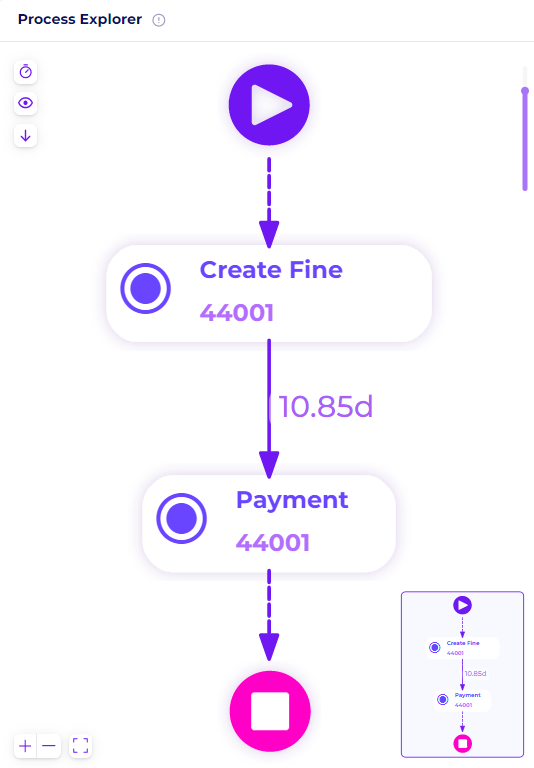
Figure 9. The Process Flow of Variant #1
This is the variant where the offenders pay the fine, without having to send the fine to the offender's home. This variant has around 44,001 cases and is the second most common variant. This is the variant with the most desirable outcome, which means that the police can collect the fine easily without having to send the fine information to the offenders. This also means that the police didn’t have to pay for the post tariffs expenses upfront
Variant #2
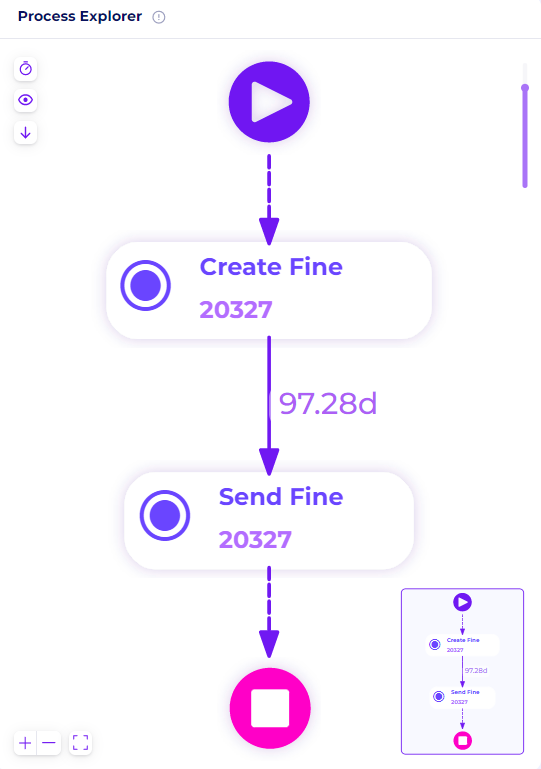
Figure 10. The Process Flow of Variant #2
This is the variant where the fine information is sent, but the information hasn’t been received by the offenders. It has around 20,327 cases. Two possible scenarios for the reasoning behind this variant: a) The journey still has not been completed, which means that these are active cases, or b) There’s something wrong with the post office process that led to offenders didn’t receive the information. Both could be analyzed further down later.
Variant Analyzer
We can also check all the other variants. To do this, click the Variant Analyzer tab at the bottom of the page, right next to the Discovery tab.
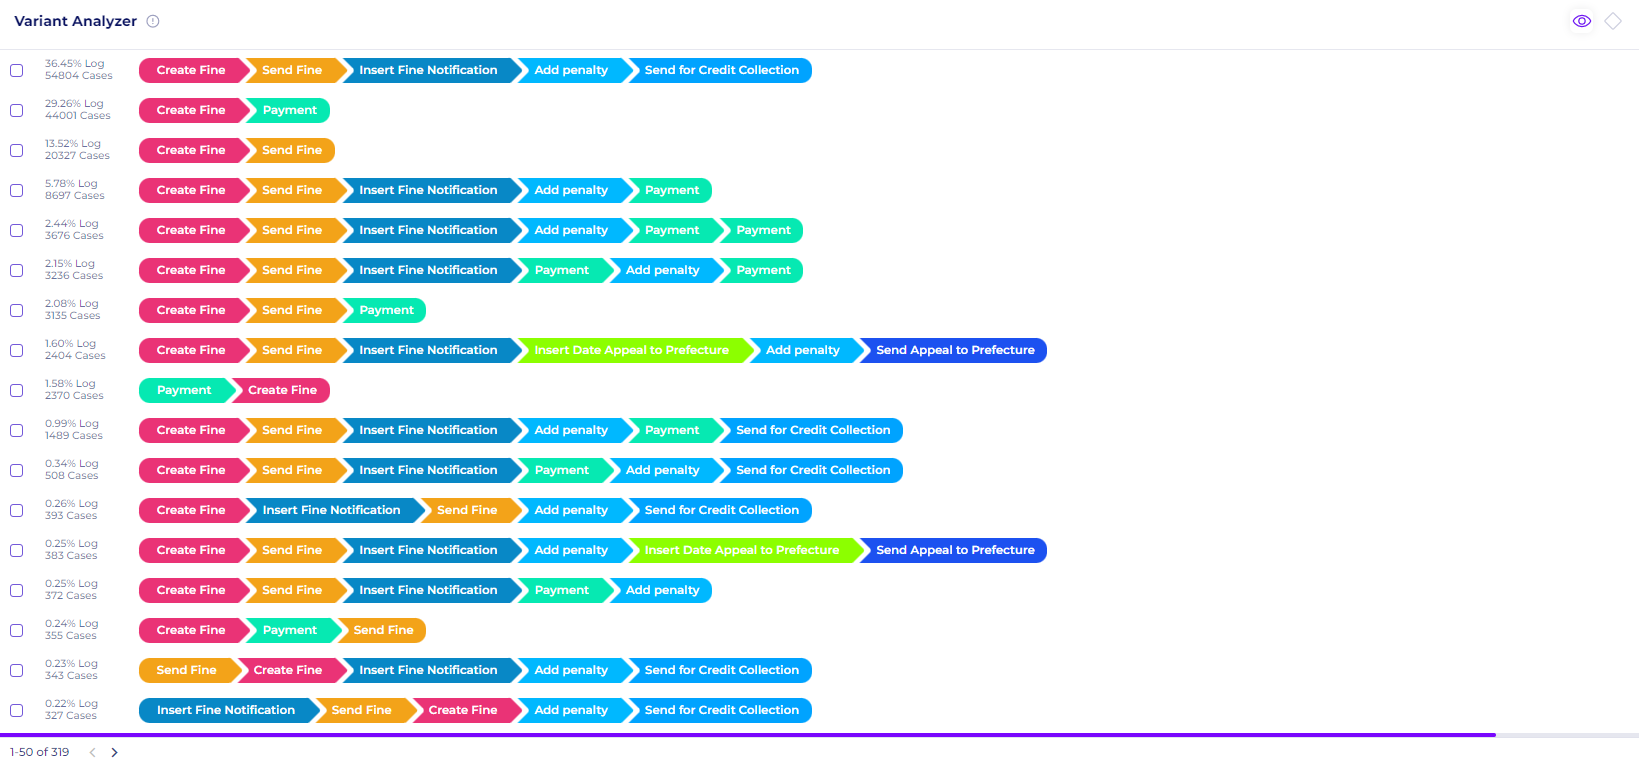
Figure 11. Variant Analyzer Tab
The Variant Analyzer tab shows all the process maps of every variant, the number of cases in each variant, and also the total percentage. This is an easy way to see the general flow of all the cases in the dataset. Users can see which variant is ideal and which needs more attention, especially the one that doesn’t conform to the standard.
Actual Process Found in Perceptif
From the main questions, process owners want to know what’s the actual process in the dataset. To do this, we can compare the result found in Perceptif with all the possible scenarios mentioned earlier, from the most desirable outcome to the least desirable outcome.
Desirable Outcome
As mentioned previously, a desirable outcome is one where the fine is paid. We can check this by using the activity selection filter. The activity selection filter allows us to retain cases based on whether a specific activity is done within the case.
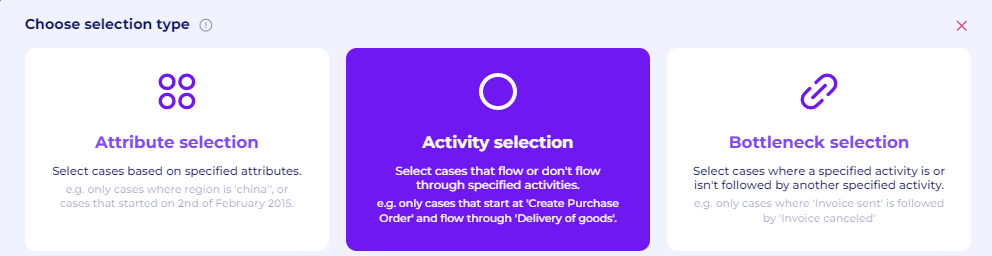
Figure 12. Activity Selection Filter
To see how many cases that are ended up being paid, we can select the Case flow through option and select the Payment activity. It will retain cases that that has payment activity in them. As we can see below, 46% of all the cases (69,715 cases) have payment activity, which means less than 50% of all cases ended up being paid. This shows there are still so many ongoing cases and cases that are ended up not being paid. Thus we can assume that fines are not being paid in proportion to the violations.
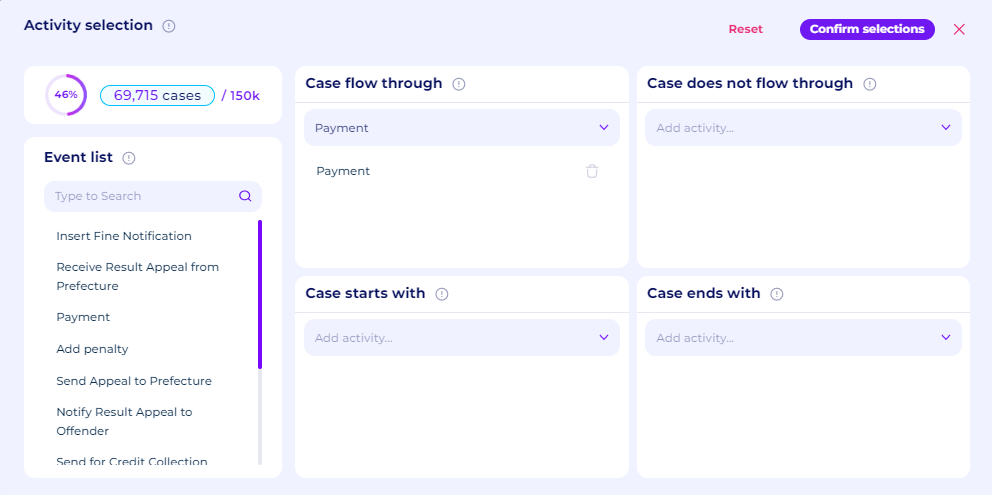
Figure 13. 46% of all the cases have Payment Activity
To check the most desirable outcome, which is the fine is paid directly after it was created, we can use the bottleneck selection filter. It will retain cases that flow with specific activities (either directly or eventually followed). To check that, we will retain cases that started by Create Fine activity and are directly followed by the Payment activity.

Figure 14. Bottleneck Selection Filter
As we can see in the discovery tab, there are around 44,001 cases that have the most desirable outcome. We also mentioned previously in the variant analyzer, this variant is the second most common variant. The median of the case duration in this variant is 5 days, one of the quickest among other variants.

Figure 15. Most Desirable variant
We can also check other desirable flows, by using the activity selection filter again, and retain cases where Payment activity exists. We can check the variant analyzer to see how the process played out.
From the variant analyzer, we can also see another variant that ended up with payment after the penalty was added. This is less ideal since the police need to send the notification and add the penalty first before the fine is paid. This also extends the case duration. The median case duration of this variant is 441 days, one of the longest among the variants.

Figure 16. Other desirable variants
Other variants that ended up paid are as follows. The fine is paid after the information is sent, but before the notification is received. This is either an active case, where the notification is still on the way (from the post office) or maybe there’s a problem with the post office, where the offenders didn’t receive the notification. Either way, the police still have to pay the post tariffs upfront, even though the notification is never received.

Figure 17. Other desirable variants
Undesired Outcome
The first undesired outcome is the one where payment isn’t made and sent to the credit collection agency. This is unideal since the police can’t track the process in the credit collection agency.
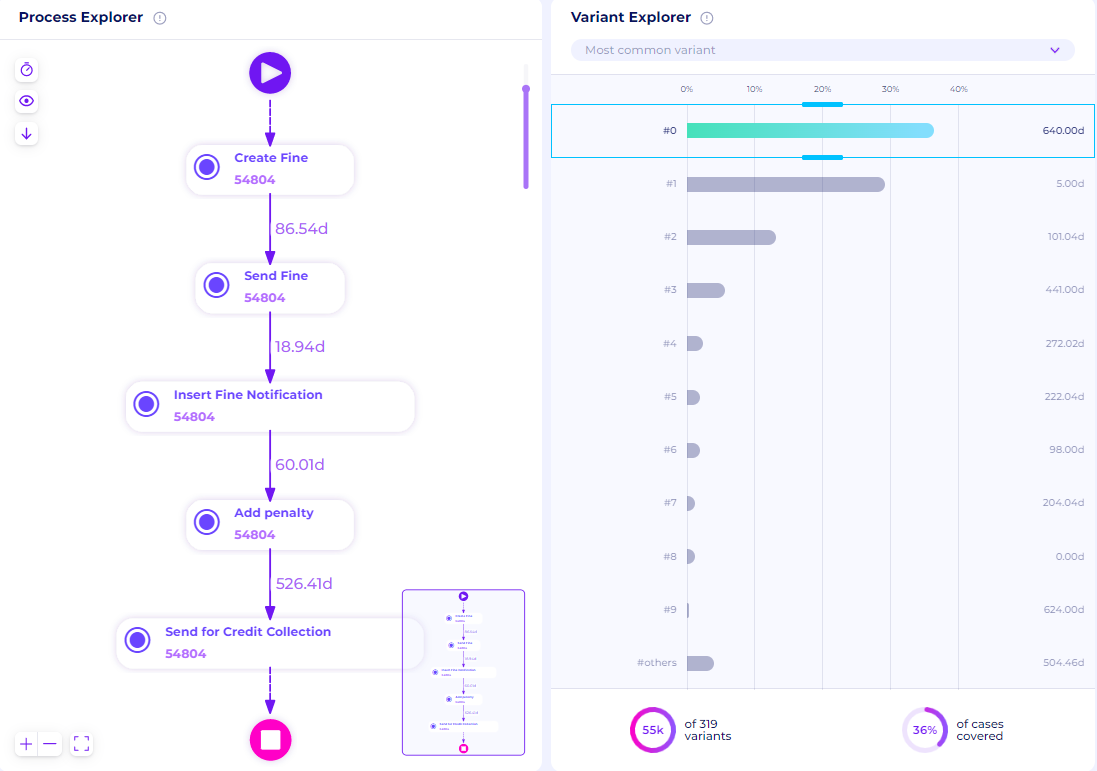
Figure 18. Least desirable variant
As we can see in Figure 18, there are around 54,804 cases where the fine isn’t paid and this is the most common variant in the dataset. This shows that the process is highly ineffective since a lot of violations are left unnoticed by the offenders. The median of the case duration is around 655 days, the longest in all variants.
Atypical Outcome
We also noticed several variants that are atypical of what we expected. For example, one variant has Payment activities multiple times, around 2.44% of all cases (3676 cases). This might be the case of payment done in installments

Figure 19. Multiple payment activities
There are also a few other variants with incorrect order of activities. All cases should start with the Create Fine activity, but some variants start the case with other activities.
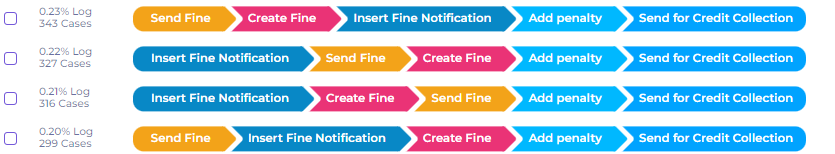
Figure 20. Incorrect Order of Activities
Create BPMN Model
After figuring out the actual model found in the dataset, we can create a business process model and notation (BPMN) to represent the process maps. This BPMN model can be integrated later as a part of the dashboard/visualization and conformance.
Select the process canvas option after clicking the new tab icon
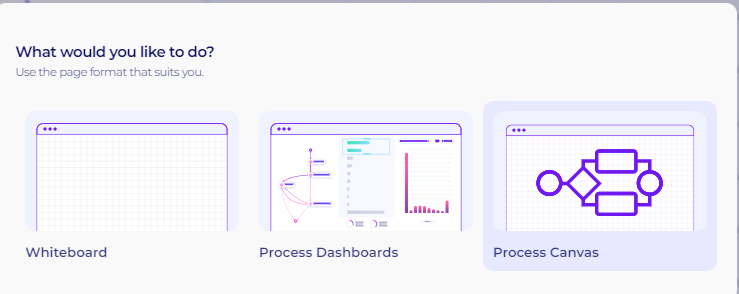
Figure 21. Process Canvas Options
A new tab will open with three options. Users can create new diagrams, select from previously uploaded diagrams, or upload from PC. Since we’re going to create a new diagram from scratch, select the first option
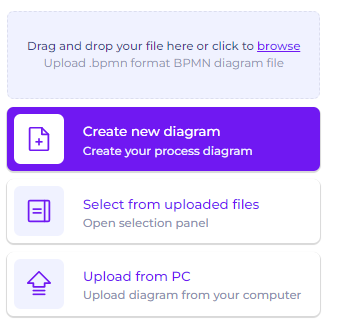
Figure 22. BPMN tab options
A new blank page will be shown in the tab. To start editing, click the edit button at the bottom left of the page

Figure 23. Edit Button in the BPMN tab
The BPMN tools will be available and can be used directly. The following video is an example of drawing the desirable process that we found from the process maps as a BPMN model
Video 1. Creating a BPMN model from the desirable process maps founds in the data
We can also save the BPMN files as BPMN, download it as SVG image, or print it as a PDF
Throughput Time
To check the total throughput time, we can see it in the discovery tab, on the Throughput Time window.
The graph in Figure 21 shows the distribution of the case duration in the dataset. We can also check other statistics by clicking on the “Average” icon at the top right.
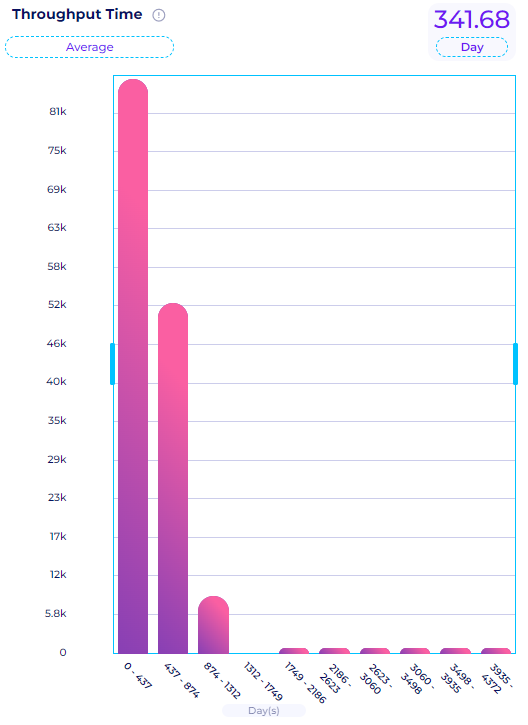
Figure 24. Throughput Time for every case

Figure 25. Temporal Statistics Options
We can check the average, median, maximum, and minimum throughput time of the case duration in the data. From perceptif, we got the following temporal statistics:
Average: 341.68 days
Median: 198.04 days
Maximum: 4372 days
Minimum: 0 days.
The temporal statistics above can give us a helicopter view of the performance in the road traffic management process. From the temporal statistics, we can see that generally, the case can take more than a year on average. This shows a lot of inefficiencies within the process and is not ideal for the organization.
We can also check the throughput time between each activity in each variant. To do that, we can click the “eye“ icon in the top left of the process explorer window.
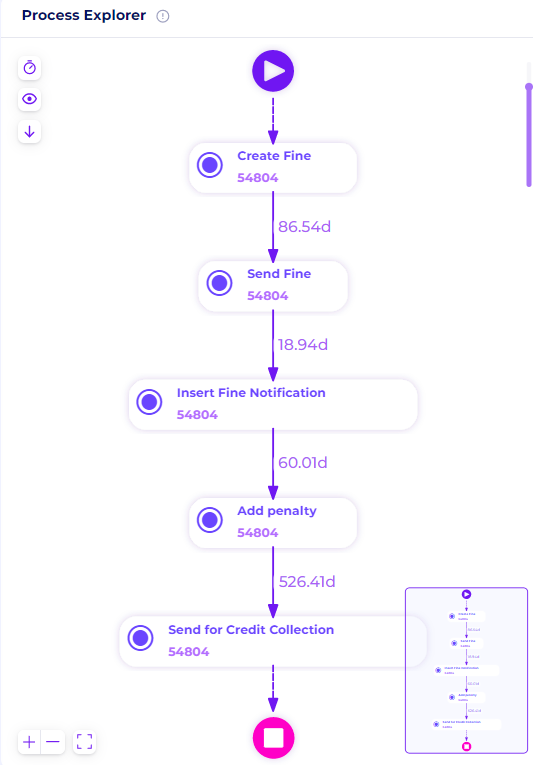
Figure 26. Details of throughput time of the most common variant
Figure 26. shows the details of the throughput time of the most common variant, which is the one where the fine isn’t paid and sent to the credit collection agency. From the process path above, we can see that the waiting time between each activity is too long. For example, the fine notification is sent on average 86 days after the fine was created. This means that the offenders didn’t get the notification of the fine for almost 3 months. This also means that the penalty was technically added more than 60 days after the fine was first created. This gives the organization a look into the performance of its activities.
Possible Improvements
After the analysis, we can get several possible improvements that the police can investigate and implement.
There’s a lot of waiting time between “Create fine“ and then “Send fine“. Considers cut the waiting time, whether by working more closely with the post office, etc
Consider mapping each type of violation with different deadlines for the offenders to pay, since there are cases where the fine is paid instantly and cases where the fine isn’t paid at all
Reevaluate how notifications are being sent to offenders, is sending via post office the most effective? There are cases that have a duration of more than 60 days, but no penalty was added since the notification isn’t received yet by the offenders
Reevaluate whether the penalty is severe enough for the offenders. The most common variant is the one where the fine isn’t paid and then it was sent to the credit collection agency.
Consider working closely with the credit collection agencies in making sure that every offender paid their fines
More insight can be gained by using Perceptif’s filters and visualization tools
Dashboard & Visualization
One of the most important parts of business process improvement is constant monitoring and evaluation. You want to be in control of all the processes happening in the day-to-day activities. This requires a good understanding of data with various visualizations.
Perceptif helps businesses visualize data streams and build dashboards for easy monitoring and evaluation. Here’s how building engaging dashboards and visualizations works.
Create a new tab by clicking on the “+” next to the Discovery tab, then “Create new page”.

Figure 27. Create a new page
Select Whiteboard to create a new whiteboard tab.
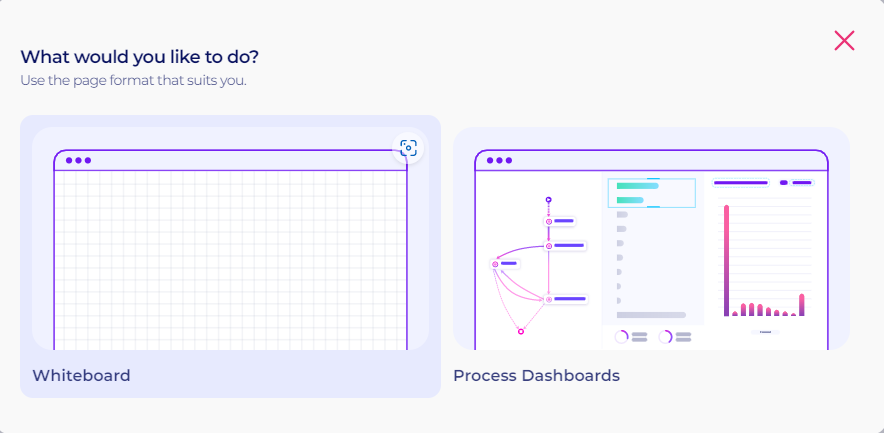
Figure 28. New tab options
To start building dashboards, click the “Edit” button at the top right.

Figure 29. Edit Button on the whiteboard
To import visualization widgets, click the “Widgets” button at the top. A new window will appear with various options to choose from.

Figure 27. Widgets button
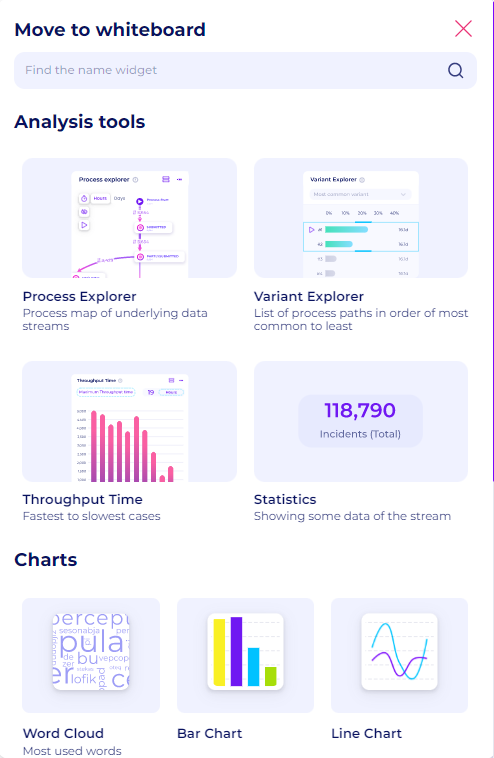
Figure 30. Data visualization widgets
Click any one of the widgets. For example, let’s create a new bar chart visualization. Drag and drop the bar chart widget to the board. A new bar chart window will then appear. To configure it, click the “Setting” button at the top of the widget.
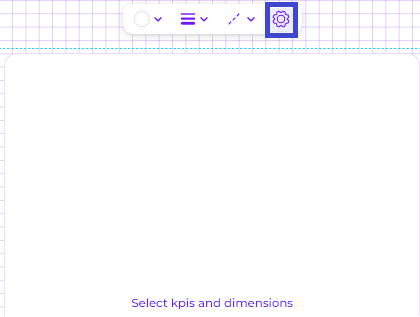
Figure 31. “Setting” button to configure the widget
Start configuring data by clicking the “data” window on the right. Add multiple KPIs and Dimensions easily with the “+” button.
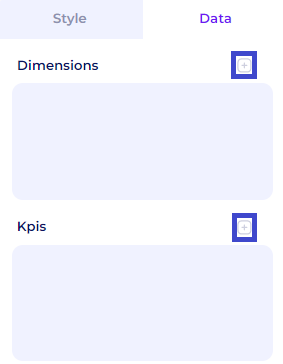
Figure 32. Add KPIs and Dimensions
Then, start adding dimensions and KPI for the visualization. For example, select “Timestampt” as dimensions, “case_id” and “activity” as our KPI. Perceptif also allows various other functions for KPIs (Sum, Average, Max, Min, Count, and Count Distinct).

Figure 33. Select dimensions for visualization
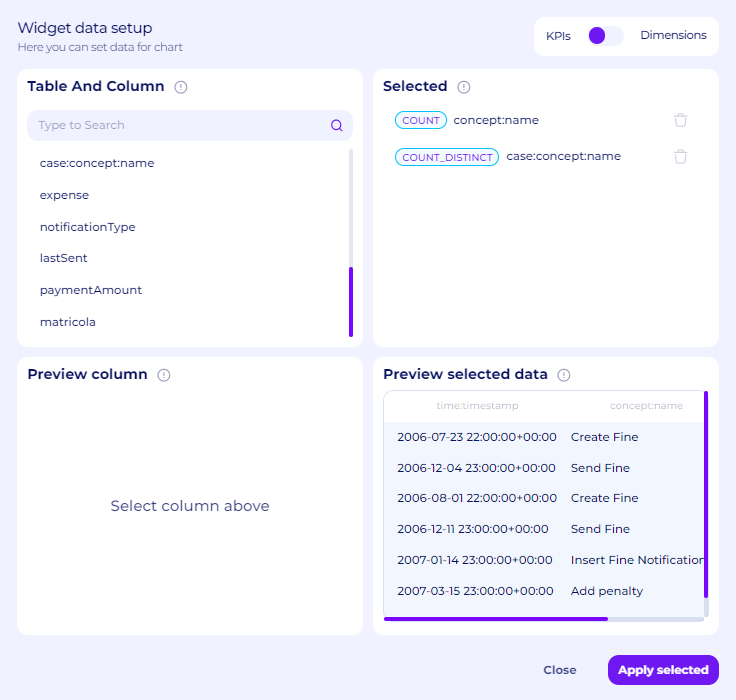
Figure 34. Select KPIs for visualization
After clicking “Apply Selected”, the visualization will be shown on the whiteboard. You may also sort values with the “Sorting” option below Dimension and KPI.
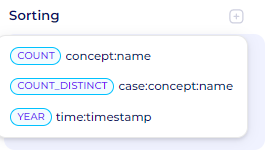
Figure 35. Sort the Visualization
Adjust the title, styles, font size, and legend in the style window as you like.
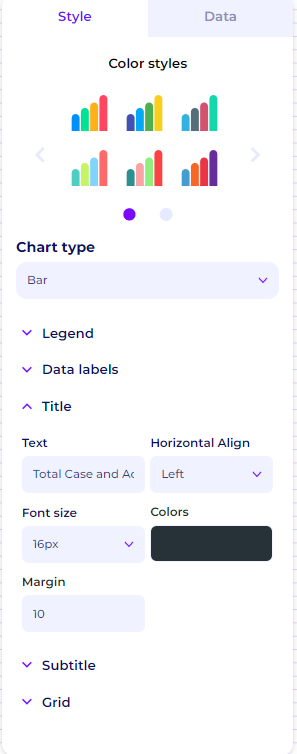
Figure 36. Style Window
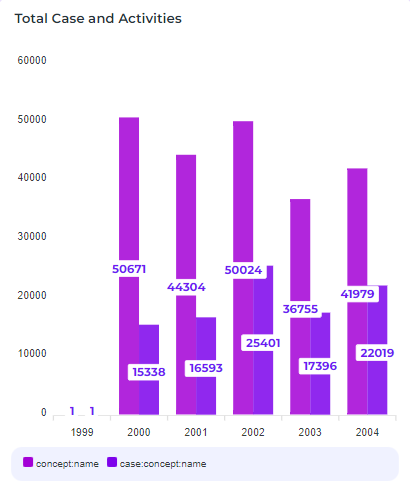
Figure 37. Bar Chart Visualization example
Now, you can start to create engaging visualizations and build complete dashboards to kickstart your business process improvements.