
Travel Reimbursement Demo
Introduction
Reimbursement procedures are essential for businesses' efforts to manage and typically recompense staff members' and externals' travel expenses, such as guests who were invited by the company. This is the same at the University of Technology in Eindhoven (TU/e). The TU/e personnel frequently travels to conferences, other universities, for project meetings, and/or to catch up with industry peers. Like many businesses, they also have policies in place for planning trips and for reimbursing expenses. However, if not set up correctly, they also run the risk of duplicate billing expenses or postponing trip plans, incurring additional costs or resulting in the loss of business and research opportunities, which is a possibility that justifies closely reviewing their performance.
Reimbursement business operations are now frequently backed by an integrated enterprise system that keeps an event log of all activities. The timestamp, who carried out the activity, what activity was being carried out, which cases were impacted, and other information that the system can record can all be included as characteristics for each event in the log. With Perceptif, we can use this data to do a process mining analysis.
About Dataset
Dataset Format
Event data is commonly stored in tables, CSV files (Comma Separated Values), and spreadsheets (like Excel files), where each row or column represents an event. For process analysis using Perceptif, there are 3 main attributes required in your data:
Case Id: Unique identifier of each case in a process.
Events: An activity completed in a single case Id. Each can have multiple Events.
Timestamps: When activity is performed in the system. Event log data can have 2 timestamps - a start (when an event begins) and an end (when it's completed).
Other optional attributes such as case attributes and resources can also help describe the business process.
Dataset Source
The sample data is a real-life event log of the travel reimbursement process belonging to the University of Technology in Eindhoven (TU/e). It contains 8344 cases and 46,500 events that are distributed over 12 activities with timestamps between January 1st, 2018, and June 17th, 2019. This dataset has been provided for the BPI Challenge in 2020 and is publicly available. Download the modified datasets that will be used in this demonstration here.
The process can be summarized as a process where an employee submits a reimbursement submission to the system. After submission by the employee, the request is sent for approval to the travel administration. If approved, the request is then forwarded to the budget owner and after that to the supervisor. If the budget owner and supervisor are the same person, then only one of these steps is taken. In some cases, the director also needs to approve the request. In all cases, rejection leads to one of two outcomes. Either the employee resubmits the request, or the employee also rejects the request. If the approval flow has a positive result, the payment is requested and made.
Multiple files, such as domestic declarations, international declarations, travel permits, etc., can be found in the original BPI Datasets. We are simply using the domestic declaration files for this demonstration.
Dataset Attributes
Below is a description of the data attributes for our analysis.
Attributes | Description |
case_id | Case identifiers |
activity | The name of activities done in a case_id |
timestamp | The timestamp when activity was started |
resources | The entity that executed the task (can be Staff Member or System) |
role | The role of the resources (Can be Employee, Administrator, Supervisor, Undefined, Budget Owner) |
Amount | The amount of money that want to be reimbursed |
Main Questions
The University is looking to find out the quality of the process. They feel like the process in general has been quick enough but there are cases where reimbursement cases take really long time.
These are the questions they are keen to explore:
How does the actual process play out and is there a bottleneck in the activity flow?
What is the throughput of a travel declaration from submission (or closing) to payment?
How many travel declarations get rejected in the various processing steps and how many are never approved?
Understanding the activities in the data
After importing the data into Perceptif, we can start understanding our data by observing all the activities detected. To do that easily, we can utilize the whiteboard and the visualization tools in Perceptif.
Create a new tab by clicking on the “+” next to the Discovery tab, then “Create new page”.

Figure 1. Create a new page
Select Whiteboard to create a new whiteboard tab.
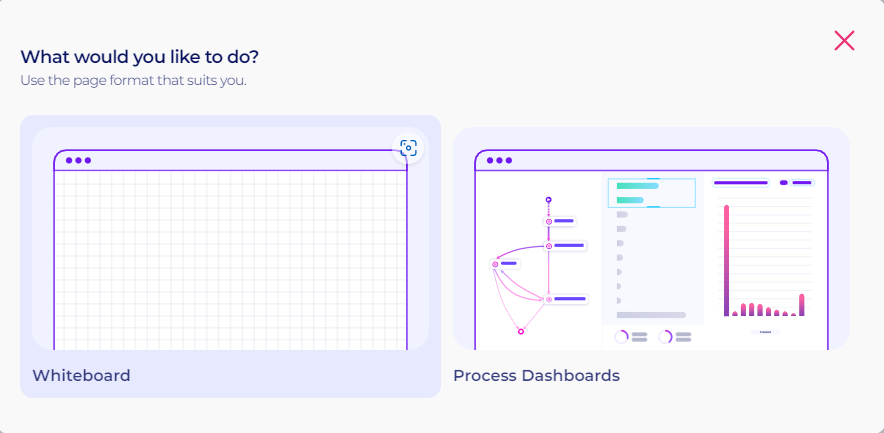
Figure 2. New tab options
To start building dashboards, click the “Edit” button at the top right.

Figure 3. Edit Button on the whiteboard
To import visualization widgets, click the “Widgets” button at the top. A new window will appear with various options to choose from. For now, let’s pick the Simple Table. Drag and drop the Simple Table icon onto the whiteboard

Figure 4. Widgets button
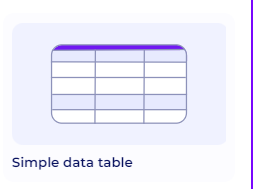
Figure 5. Simple Data Table widget
To configure it, click the “Setting” button at the top of the widget.

Figure 6. Setting icon on top of the widget
Start configuring data by clicking the “data” window on the right. Add multiple KPIs and Dimensions easily with the “+” button.
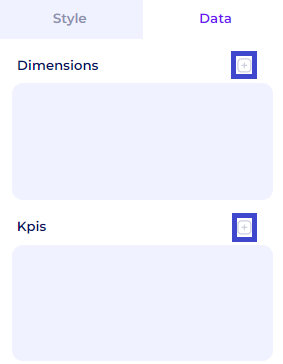
Figure 7. Add KPIs and Dimensions
For the time being, we want to look at the activities that are performed in the dataset and how frequently they occur. To do that, select the activity attribute as the dimensions, and case_id with the count function as the KPI.
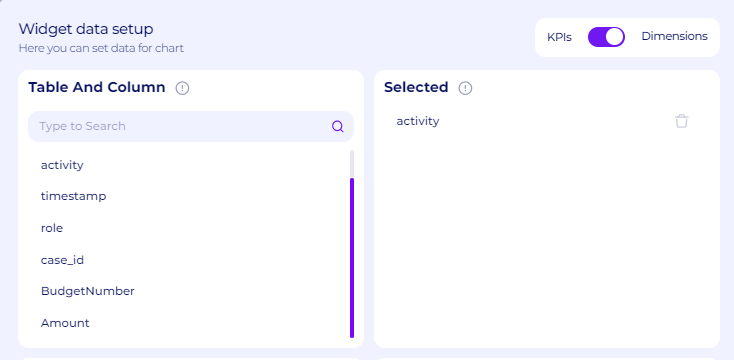
Figure 8. Activity as the dimensions
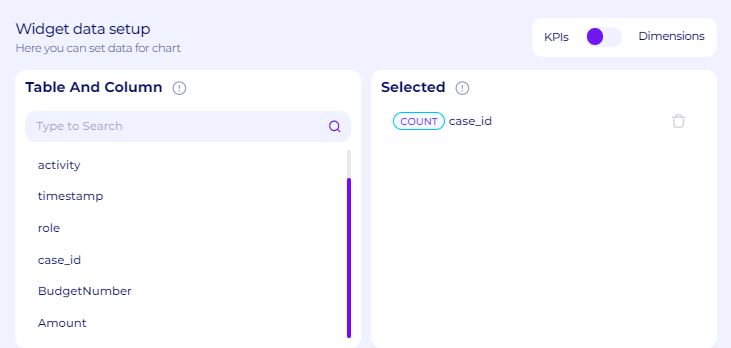
Figure 9. Count Case_id as the KP
A new table will load, showing us the list of the activities found in the data. As we can see, there are 5 basic activities as follows
Declaration APPROVED activities by Administration, Budget Owner, and Supervisor
Declaration Rejected activities by Administration, Budget Owner, Employee, Missing and Supervisor
Declaration Saved by Employee
Declaration Submitted by Employee
Payment Activities, such as Payment Handled and Request Payment
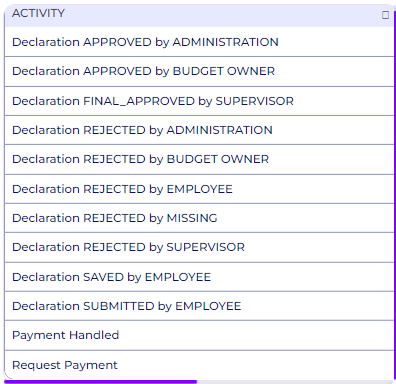
Figure 10. All activities in the data
Answers to Main Questions
How does the actual process play out and is there a bottleneck in the activity flow?
Process Discovery
The first question is related to the process discovery part of the analysis. Perceptif automatically detects all possible process maps found in the dataset in the discovery tab. There are 3 main windows in the discovery tab, as follows:
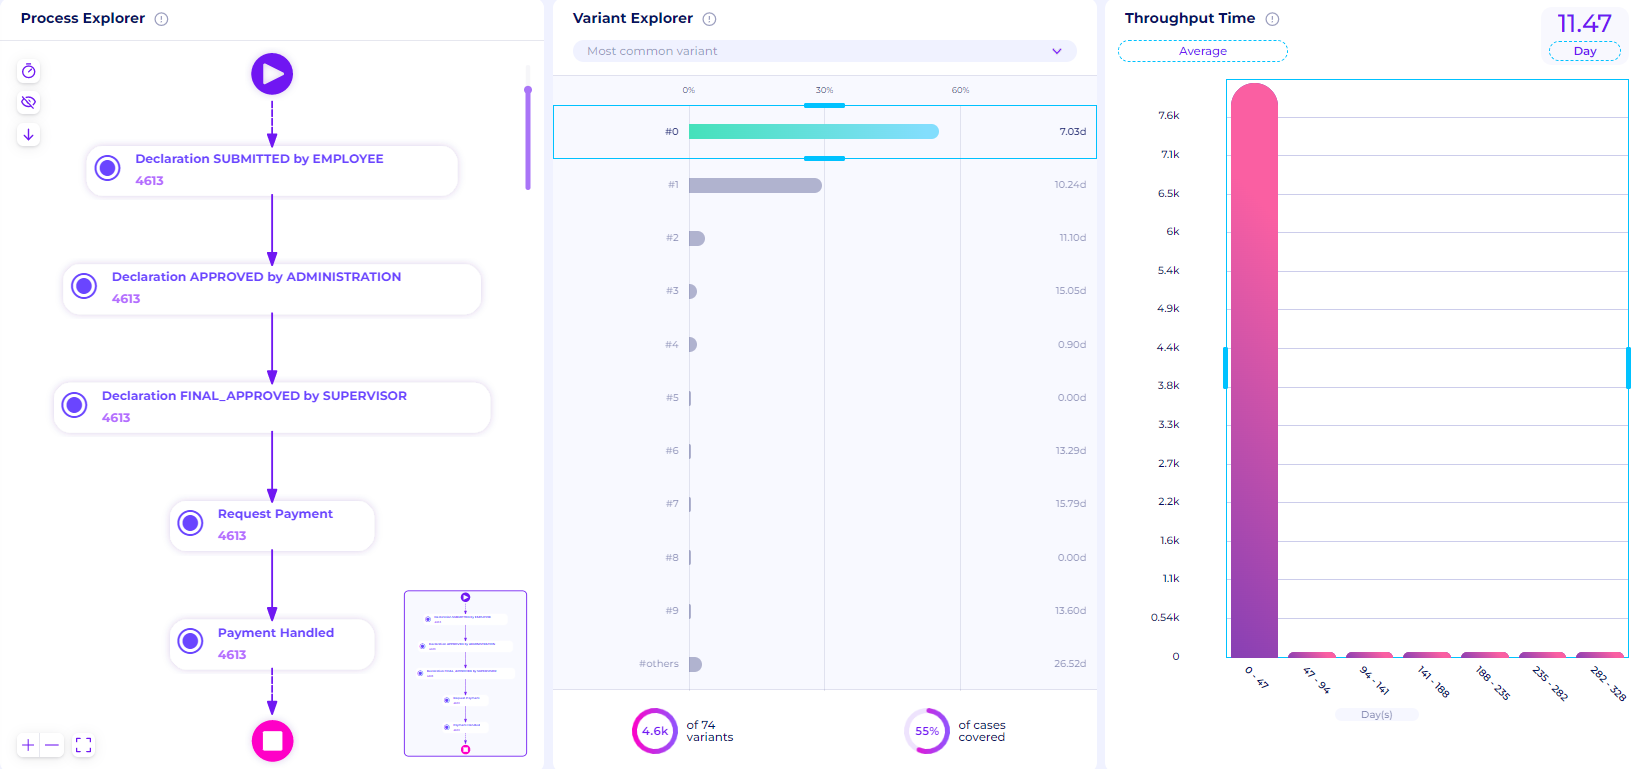
Figure 11. Three main windows of the discovery tab
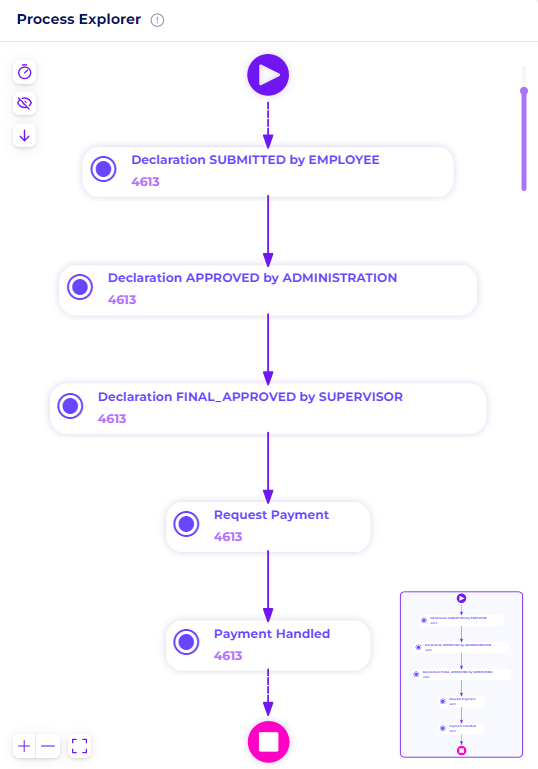
Figure 12. Process Explorer Window
On the left is Process Explorer, this window displays process maps of variants selected in the middle window.
In the middle is Variant Explorer, a window that shows the list of process paths in order of most to least common.
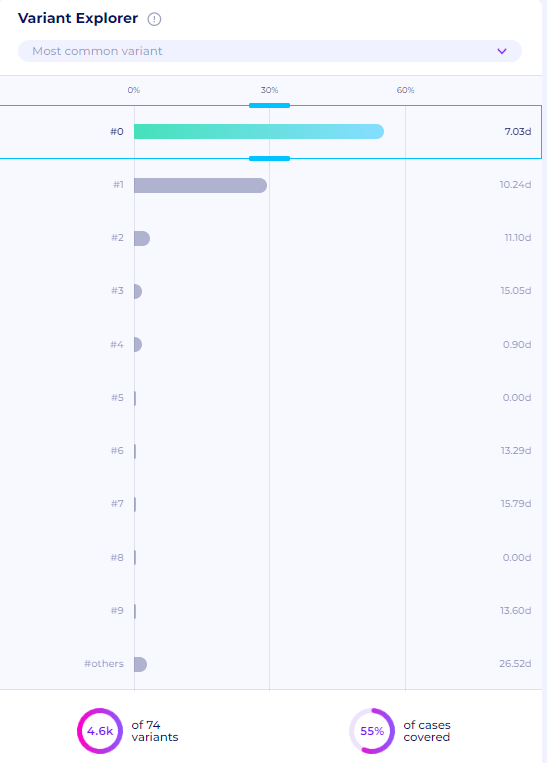
Figure 13. Variant Explorer Window
On the right window is Throughput Time, a graph that shows the case duration in data.
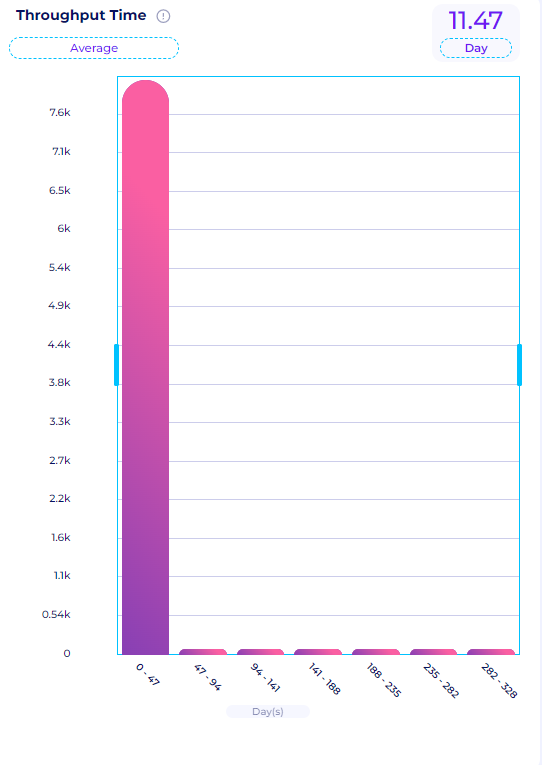
Figure 14. Throughput Time Window
Perceptif automatically detects all the process paths within the data; we call these Variants. Ideally, businesses want processes to have minimal variants to minimize deviation and increase efficiency. In reality, processes can have hundreds of paths and variations. The various variants can indicate uncontrolled processes, fraud, and/or inefficiency.
The easiest way to see the actual process in the data is to check the variant analyzer. The variant analyzer will show all possible process maps of the underlying data streams, sorted from the one with the most cases.
To check the variant analyzer, go to the variant analyzer tab, which is next to the discovery tab

Figure 15. Variant Analyzer tab
The full variant analyzer tab will show all the possible process maps, sorted from the most common variant. There’s also statistical information, which is the number of cases in each variant and the percentage next to the process map
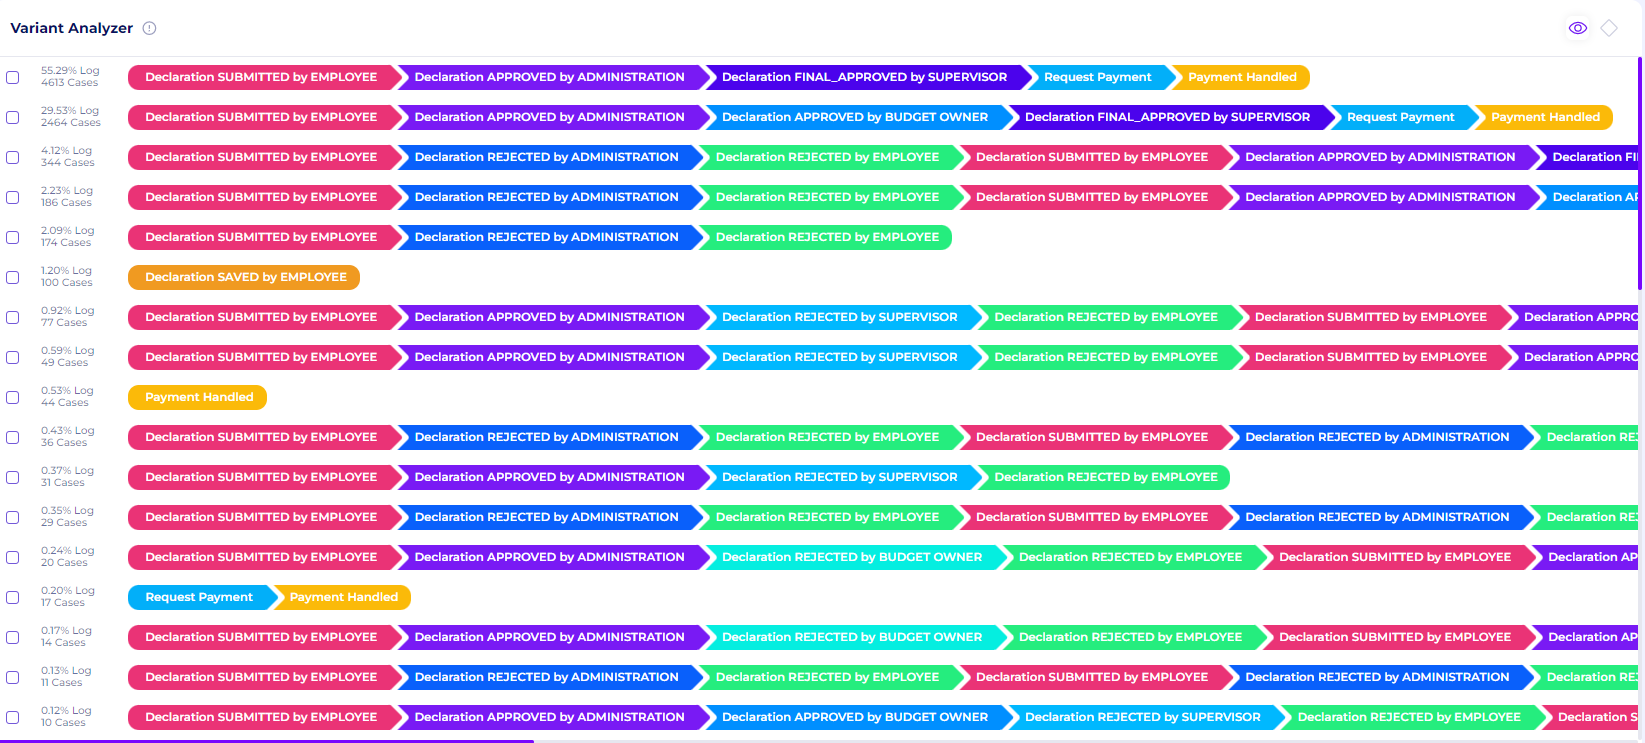
Figure 16. Variant Analyzer Page
If the checkbox next to the process maps is ticked, it will show a case explorer page. This shows the list of cases corresponds to that specific variants
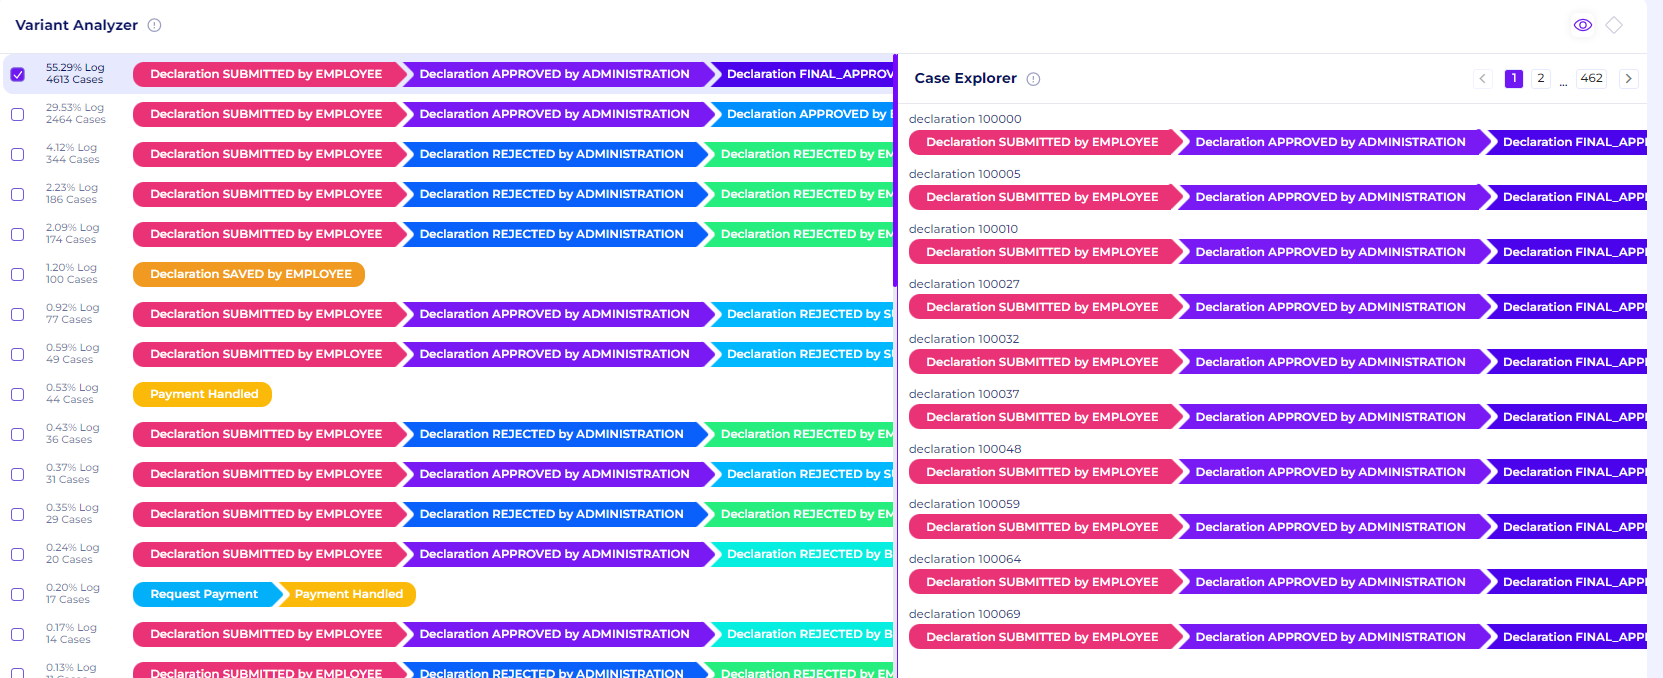
Figure 17. Case Explorer of a Variant
If one of the activities of a specific case id is clicked, it will show the detail of that case and all the attributes of that case id
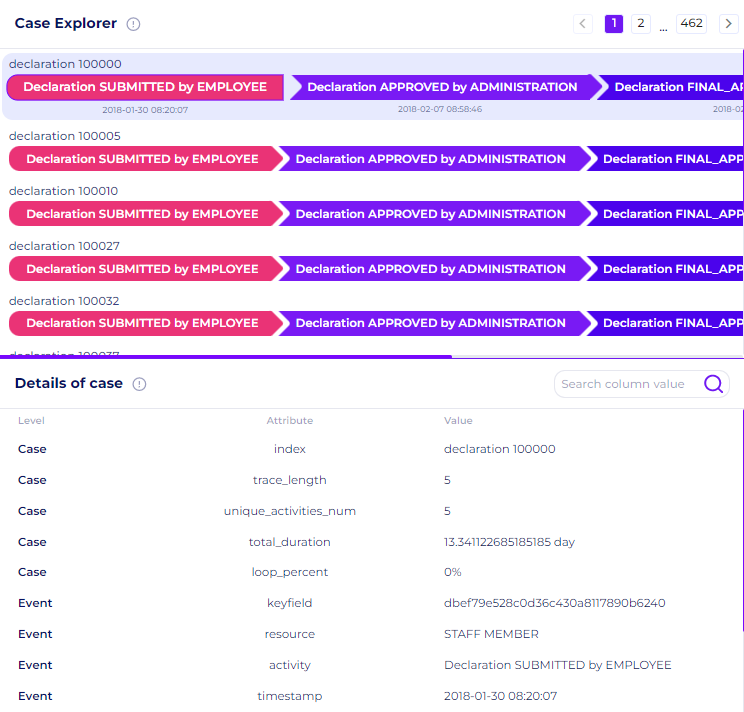
Figure 18. Details of a case
We can see that there are approximately 74 different variants of the data on the variant analyzer page. It would take far too much time to analyze every variation. This is why we should limit our attention to the most prevalent variants during the analysis's process identification phase. The version displayed by Perceptif has already been automatically sorted from most common to least common.
Let's concentrate on the top 5 most prevalent variations. We can return to the discovery tab to gain a good look at the process maps. The most prevalent variety accounts for about 4613 cases, or about 55% of all cases, as seen in the figure below. This variation addresses straightforward declaration situations, in which the administrator and supervisor give their approval before the payment is processed and reimbursed. This is definitely still part of the ideal variants
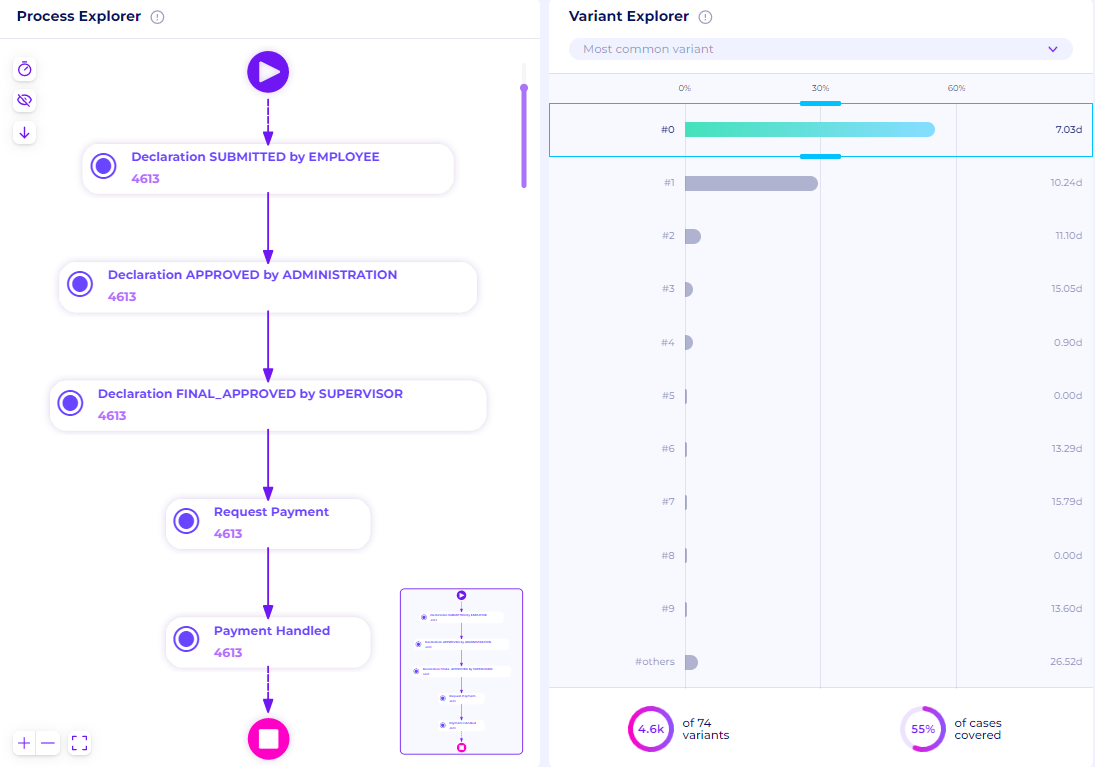
Figure 19. Process Maps of the most common variant
The second most frequent variety accounts for about 2464 cases, or 30% of all cases. With one more approval activity by the Budget owner, this variation is pretty identical to the previous one. This indicates that the supervisor and the budget owner are two different people, and their consent was needed.
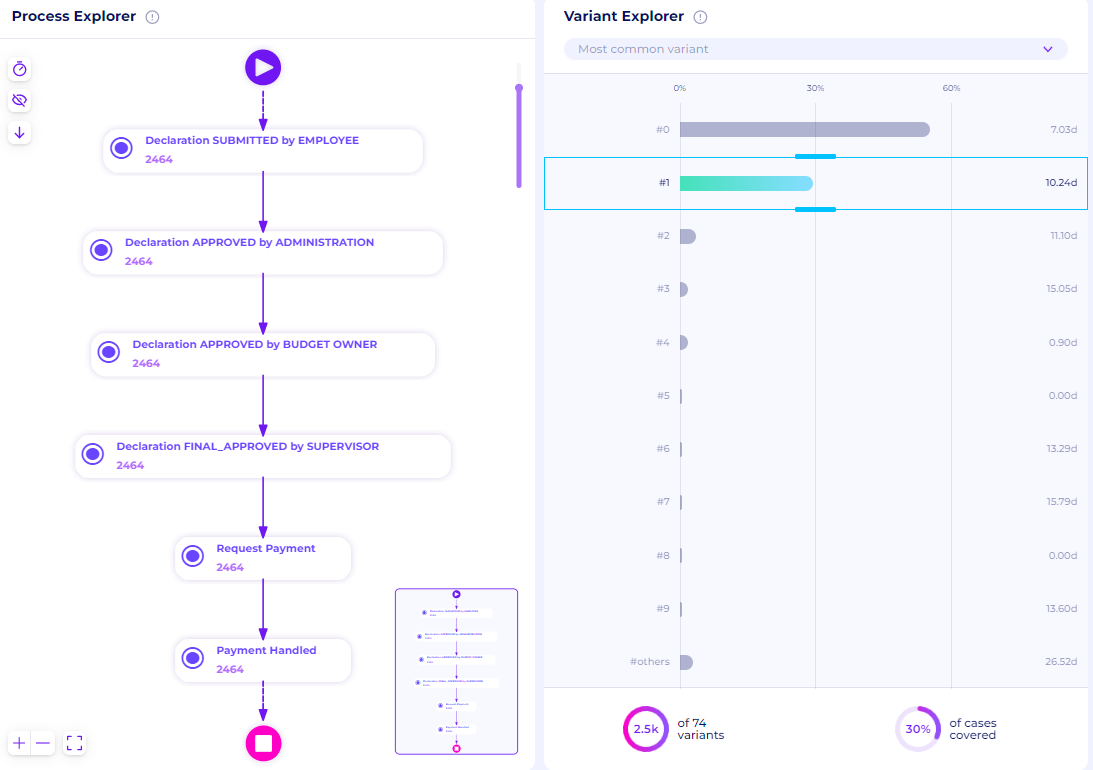
Figure 20. Process Maps of the second most common variant
In comparison to the first two versions, the number of cases for the following few variants is quite low. The rejected activity is present in the third most prevalent form which covers 4% of all cases (344 cases). The process maps show that the case is initially denied by administrators and then again by the employee. The case was then submitted again by the applicant with the same case ID. After the resubmission, the case is authorized by the administrators and supervisors. Although there was rejection activity before it was accepted, this is comparable to the original variation.

Figure 21. Process Maps of the third most common variant
The next most common variant covers 2% of all cases with 186 cases. This variant is basically the same as the previous one with rejection but with the additional activity of approval by the budget owner after the resubmission.
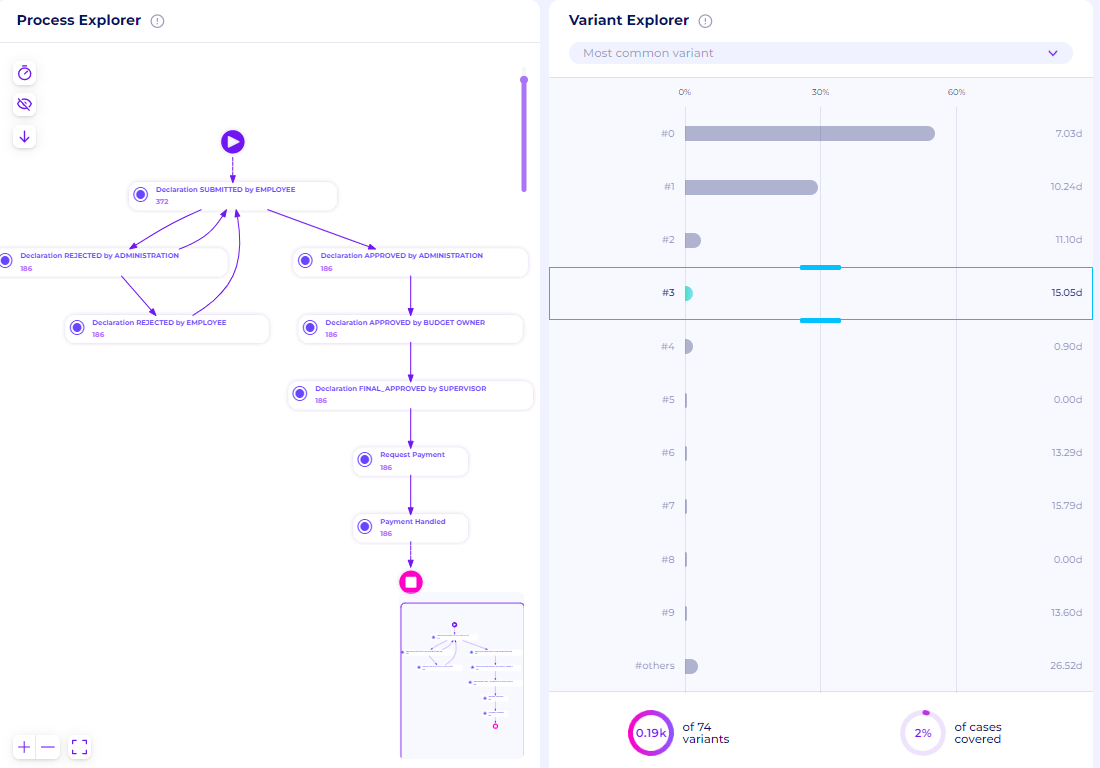
Figure 22. Process Maps of the fourth most common variant
All of the ideal flows of the reimbursement process are covered by the top 4 variants. With the slider in the variation explorer, we can choose all of the top 4 variants to obtain the process maps. We can observe that 91% of the cases are covered by the top 4 variants. This indicates that the majority of the cases can be regarded as ideal. However, we can also see that there are a total of 74 variants, which indicates that 9% of them are uncontrolled with various process maps.
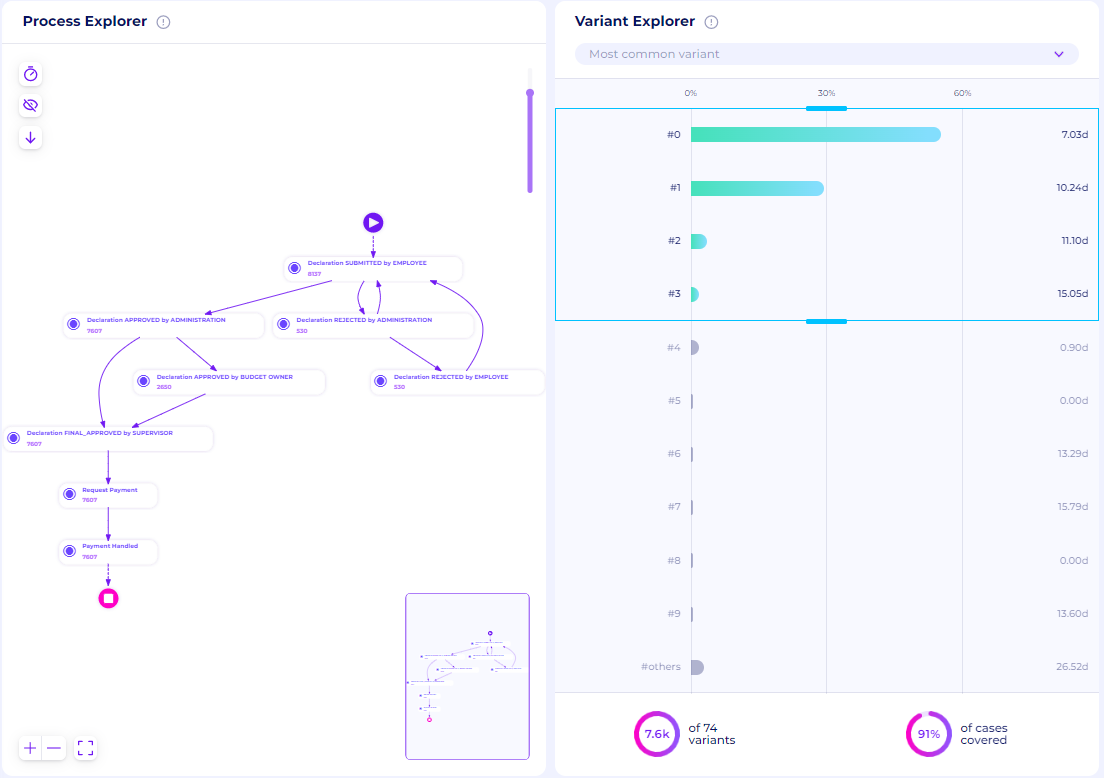
Figure 23. Top 4 Process maps
Create BPMN Model
After figuring out the actual model found in the dataset, we can create a business process model and notation (BPMN) to represent the process maps. This BPMN model can be integrated later as a part of the dashboard/visualization and conformance.
Select the process canvas option after clicking the new tab icon
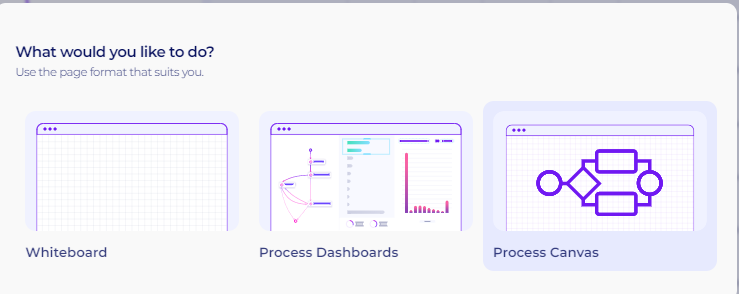
Figure 24. Process Canvas Options
A new tab will open with three options. Users can create new diagrams, select from previously uploaded diagrams, or upload from PC. Since we’re going to create a new diagram from scratch, select the first option
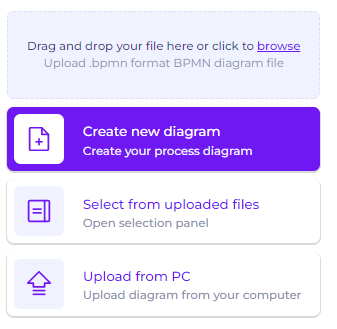
Figure 25. BPMN tab options
A new blank page will be shown in the tab. To start editing, click the edit button at the bottom left of the page

Figure 26. Edit Button in the BPMN tab
The BPMN tools will be available and can be used directly. The following video is an example of drawing the first variant that we found from the process maps as a BPMN model.
Video 1. Creating a BPMN model of the most common variant
If we draw all the top 4 variants as BPMN, we get the following process model
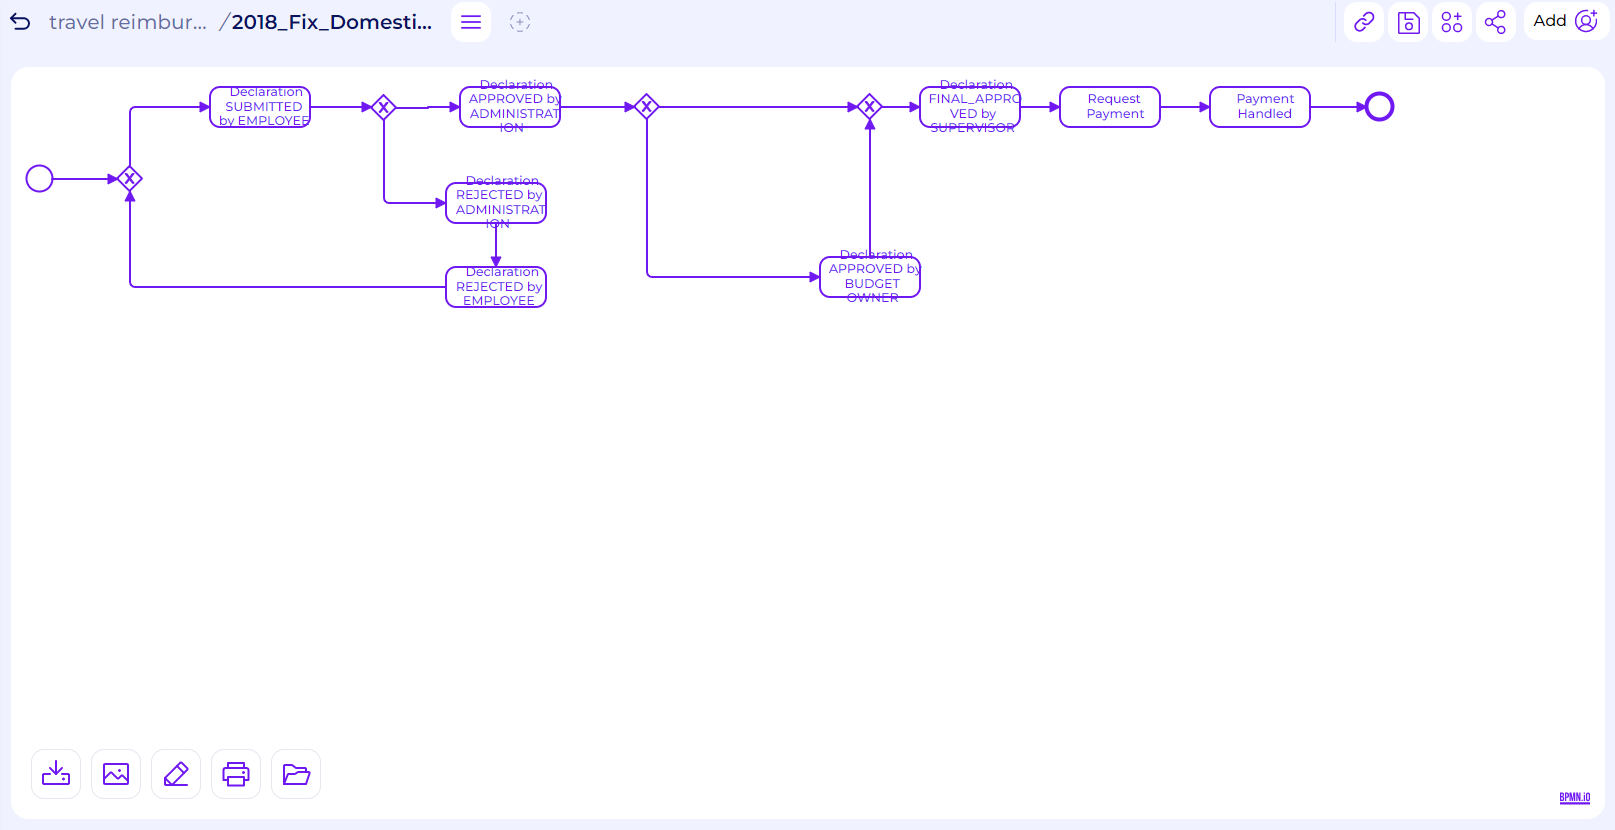
Figure 27. BPMN model of top 4 variants
Bottlenecks and Redundancy
We can continue our analysis of the activity flow by discovering cases with bottlenecks and redundancy. One thing that should be analyzed is the possibility of task redundancy, where a specific task is always followed by another task. Redundancy could extend the overall case duration. To observe the possibility of redundancy, we can use the variant analyzer tab again.
From the variant analyzer, we can easily observe that every rejection activity by the administration, supervisor, or budget owner is always followed by a “Declaration REJECTED by Employee“ activity. This is a sign of redundancy, especially when the case is resubmitted again by the same employee
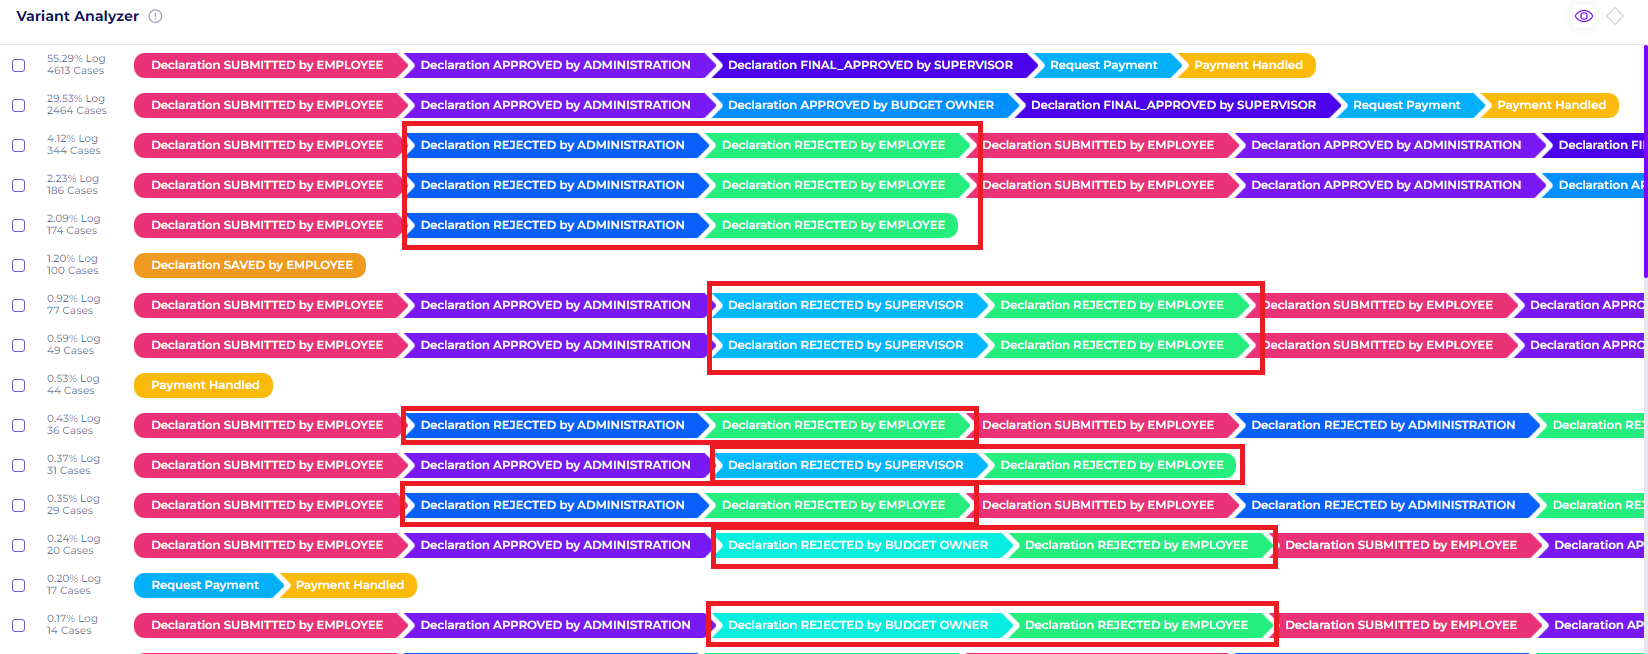
Figure 28. Redundancy in rejected cases
To check if our assumption is valid, we can use the activity selection filters to retain cases that flow through specific activities.
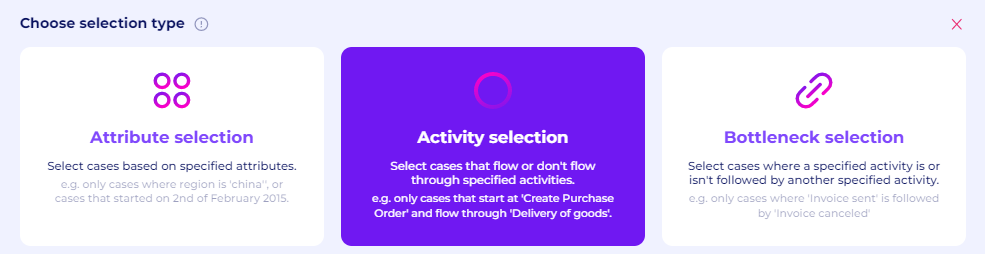
Figure 29. Activity Selection filters
For now, let’s observe cases that flow through the “Declaration REJECTED by ADMINISTRATION“ activity, and then confirm the selection
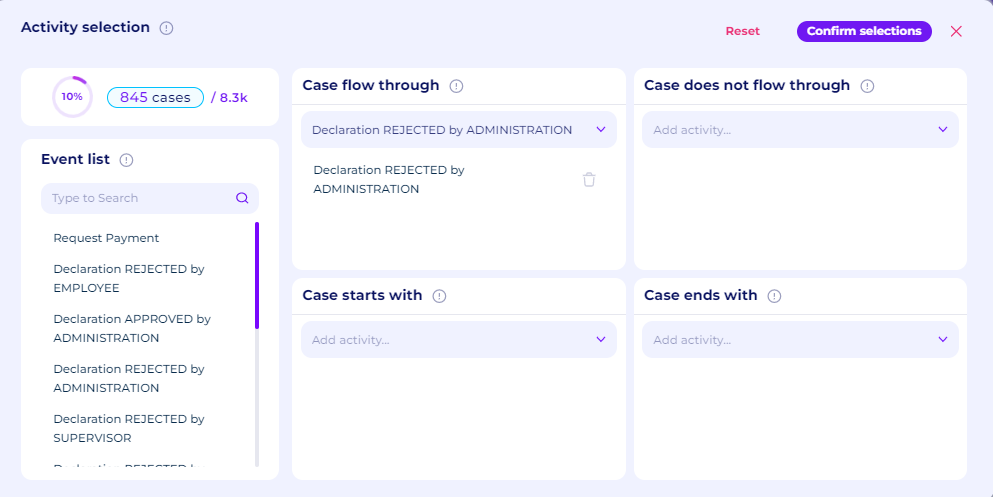
Figure 29. Case Flow Through Option
We can see in the variant analyzer that every “Declaration REJECTED by ADMINISTRATION“ is always followed by “Declaration REJECTED by EMPLOYEE“ which is a sign of redundancy. This also doesn’t make sense since the declaration itself is not fully rejected, since most of the time, the employee will resubmit their claim again.
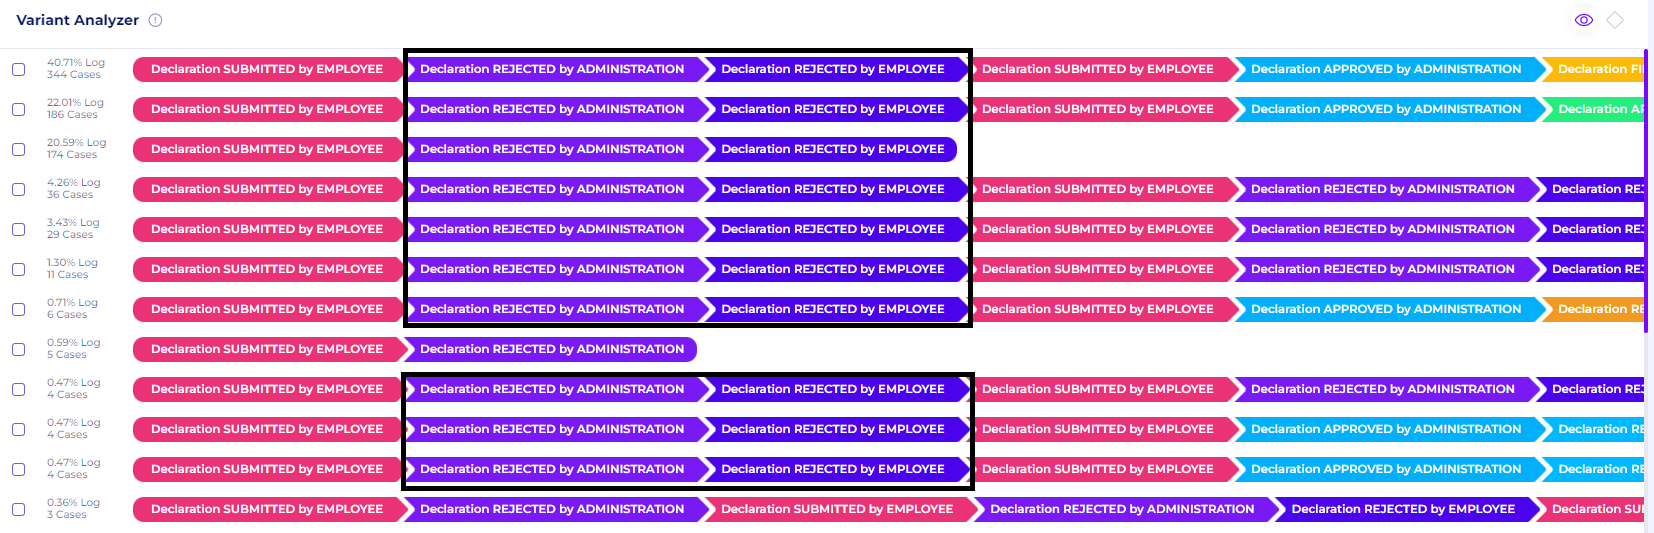
Figure 30. Variant Analyzer with the filters
We can close the filters that we applied. Now, let’s confirm our assumption once again, but now using the bottleneck filters. With bottleneck filters, we can select cases where specified activities are followed/not followed by another specified activity
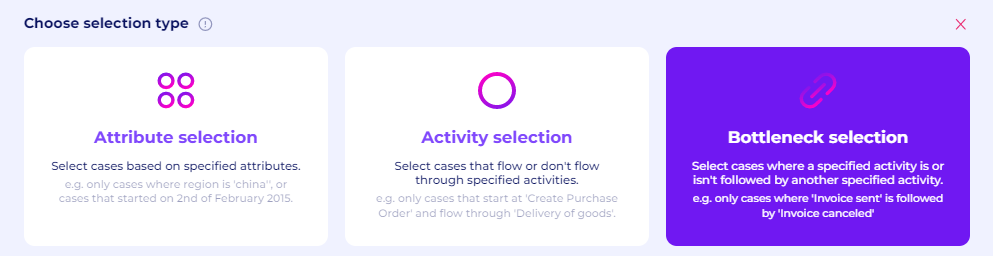
Figure 31. Bottleneck Selection
For the details, select “Declaration REJECTED by SUPERVISOR“ directly followed by “Declaration REJECTED by EMPLOYEE“
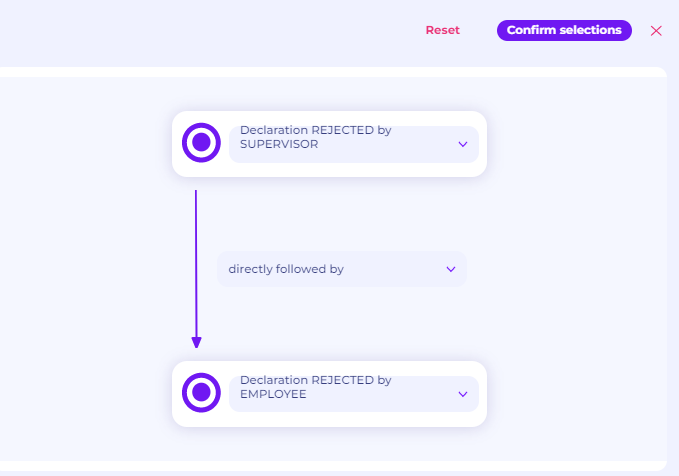
Figure 32. Bottleneck Selection filters details
Again, we see in all the variants that every “Declaration REJECTED by SUPERVISORS“ is also always followed by “Declaration REJECTED by EMPLOYEE“. Thus, we can conclude that the “Declaration REJECTED by EMPLOYEE“ in resubmission cases is redundant.
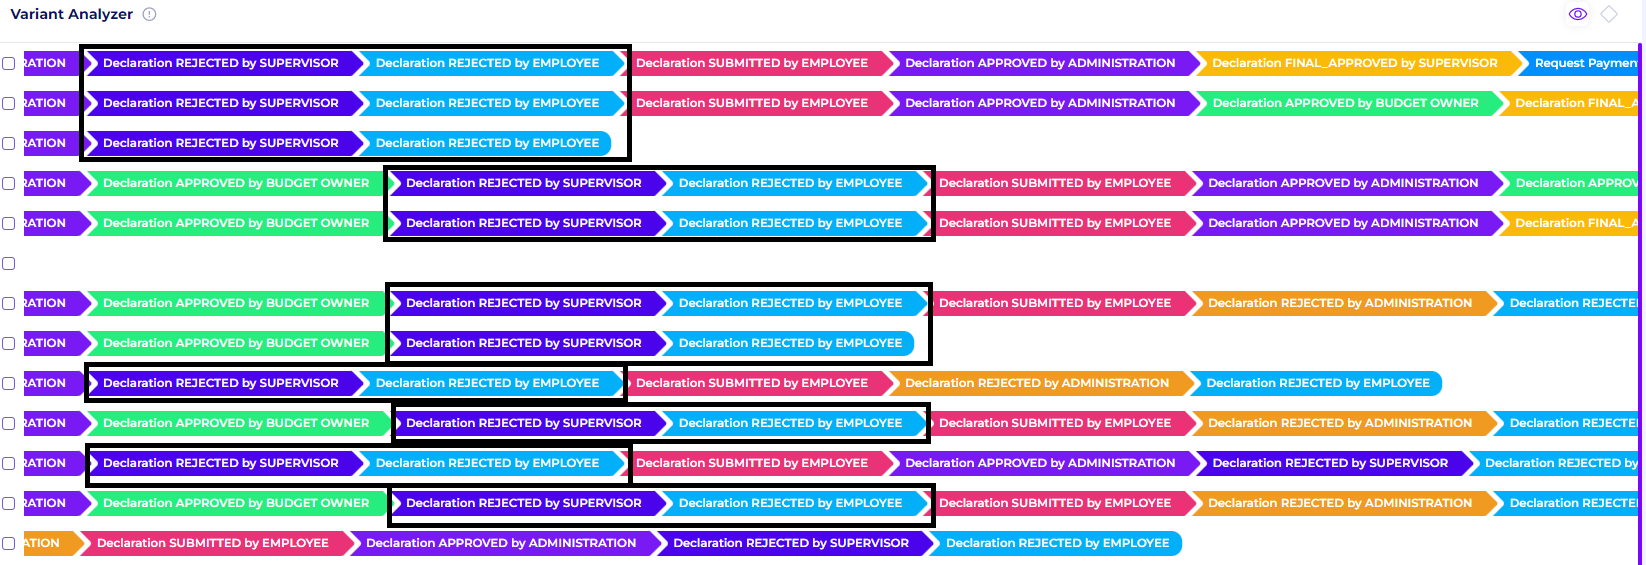
Figure 33. Variant Analyzer with the filters
To check how long this redundancy extends the case, we can go back to the discovery tab and apply new activity selection filters. We will retain cases that flow through the “Declaration REJECTED by EMPLOYEE“ activity.

Figure 34. Activity Selection filters
To observe the full variants, select all variants in the variant explorer window with the slider.

Figure 35. Selecting all variants
By clicking the full-screen option of the process explorer and the eye icon on the top left to show the throughput time, we can see that on average, the “Declaration REJECTED by EMPLOYEE“ activity extends the overall cases for 2.04 - 3.26 days. The university should consider removing this activity to improve efficiency.
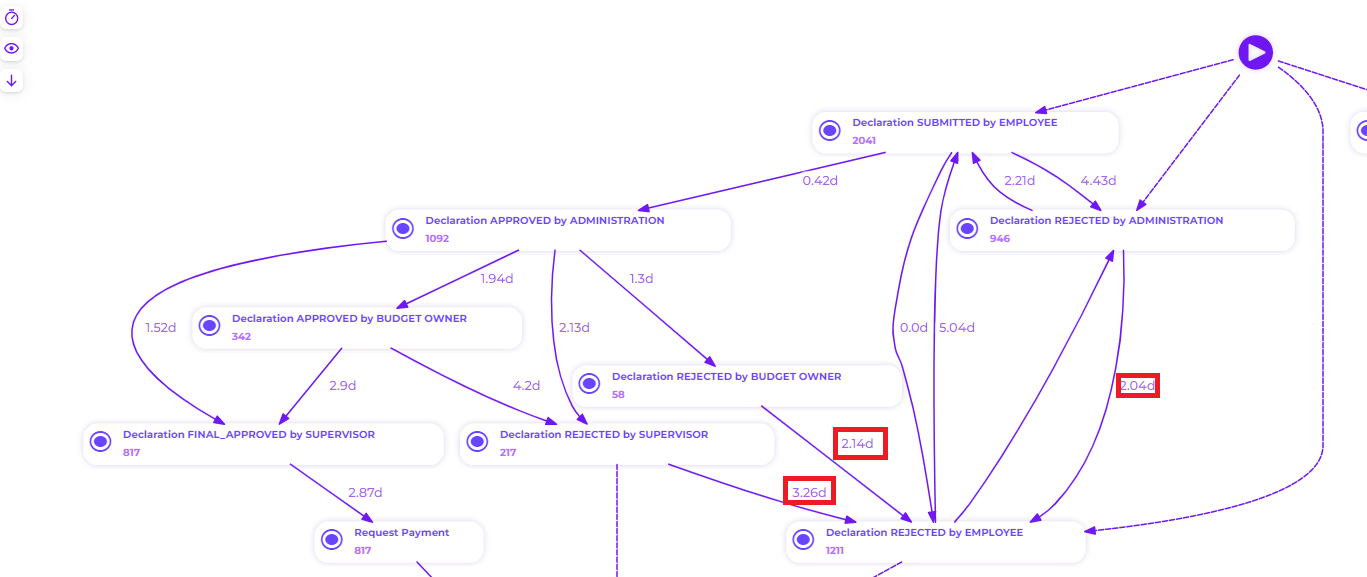
Figure 36. Process Maps of cases with “Declaration REJECTED by EMPLOYEE“ activity
What is the throughput of a travel declaration from submission (or closing) to payment?
Activity Throughput Time
To check the total throughput time, we can see it in the discovery tab, on the Throughput Time window.
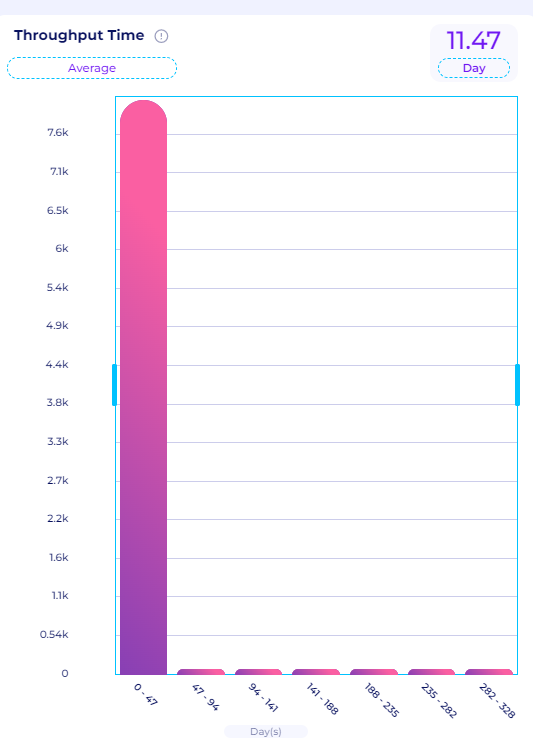
Figure 37. Throughput Time for every case
The graph in Figure 37 shows the distribution of the case duration in the dataset. We can also check other statistics by clicking on the “Average” icon at the top right.
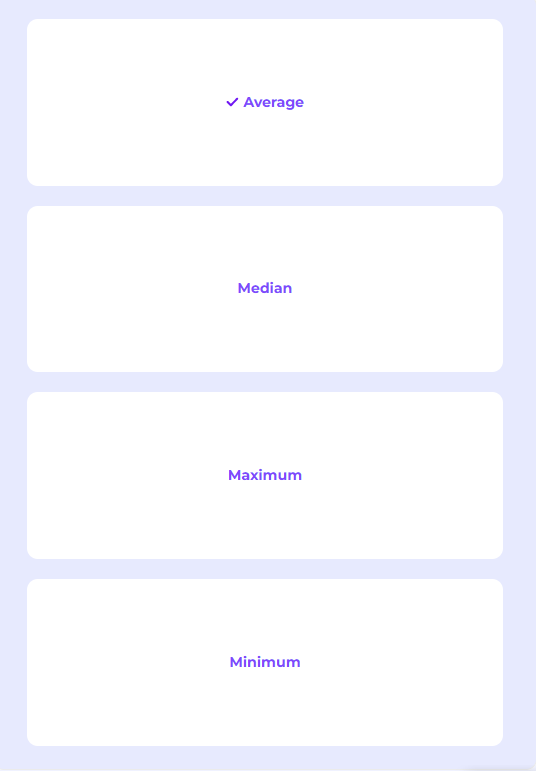
Figure 38. Temporal Statistics Options
We can check the average, median, maximum, and minimum throughput time of the case duration in the data. From perceptif, we got the following temporal statistics:
Average: 11.47 days
Median: 7.81 days
Maximum: 469.24 days
Minimum: 0 days.
The temporal statistics above can give us a helicopter view of the performance in the road traffic management process. From the temporal statistics, we can see that generally, the case can take more than a year on average. This shows a lot of inefficiencies within the process and is not ideal for the organization.
We can also check the throughput time between each activity in each variant. To do that, we can click the “eye“ icon in the top left of the process explorer window. For example, let’s select the top 4 variants once again and see the throughput time
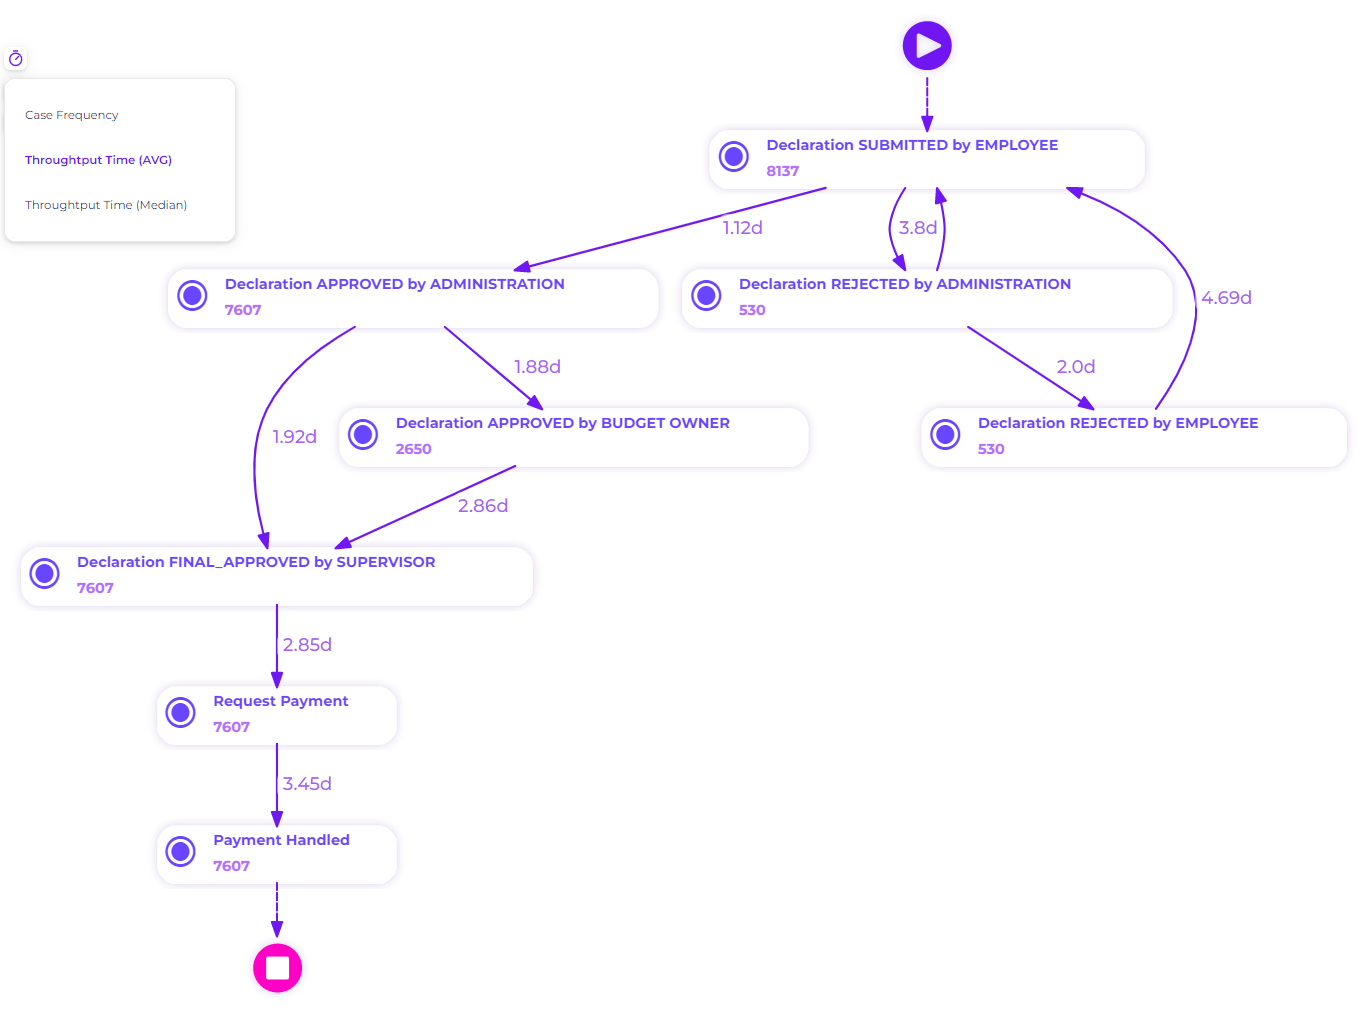
Figure 39. Throughput Time of top 4 variants
The figure above illustrates the average throughput time between each activity in the top 4 variants. Multiple insights can be gained from this process map.
The longest throughput time is between Declaration REJECTED by Employee and Declaration SUBMITTED by Employee, around 4.69 days. This flow happens when the declaration submitted is rejected by the administration. This shows that resubmission still extends the overall case duration and needs to be evaluated
The average waiting time between Declaration SUBMITTED by Employee and Declaration REJECTED by ADMINISTRATION also took quite a long time, around 3.8 days. This is quite long compared to the one where the declaration is approved by the administration, which is only around 1.12 days. This shows that cases that ended up canceled took way too long to be confirmed by the administration. The activity Declaration REJECTED by ADMINISTRATION needs to be evaluated or automated.
As mentioned in the dataset introduction, after submission by the employee, the request is sent for approval to the travel administration. If approved, the request is then forwarded to the budget owner and after that to the supervisor. If the budget owner and supervisor are the same person, then only one of these steps is taken. We can see that instances that require approval from both the budget owner and supervisors typically take longer to approve than situations that only require supervisor approval. Between Declaration APPROVED by BUDGET OWNER and Declaration APPROVED by SUPERVISORS, there is a particularly long waiting period of 2.86 days. This indicates that the supervisors took longer than the budget owner to approve the submissions.
Requesting payment and handling payment both took a considerable amount of time. This is not ideal because the payment action should also be carried out soon after the declaration has been authorized. This waiting period adds nothing to the business process as a whole. An ineffective external payment system (accounts payable) could also be to blame for the delay.
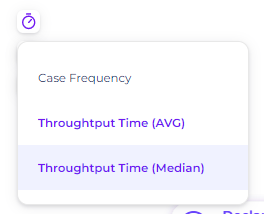
Figure 40. Changing the throughput time view to the median
By selecting the timer symbol in the top left, we can also view the median throughput time. Because not all event logs are distributed according to a normal distribution, it is also crucial to pay attention to the median. Particularly in this dataset, it is clear from the throughput time window in Figure 27 that the distribution of the cases is not normally distributed but rather has a long tail.
Instead of days, we may instead show the throughput time in minutes and hours. This will be useful since, if the cases are not distributed properly, the median will typically last less time than the average.
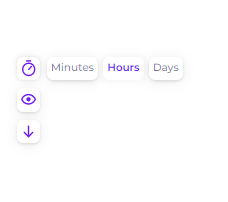
Figure 41. Change the view to hours
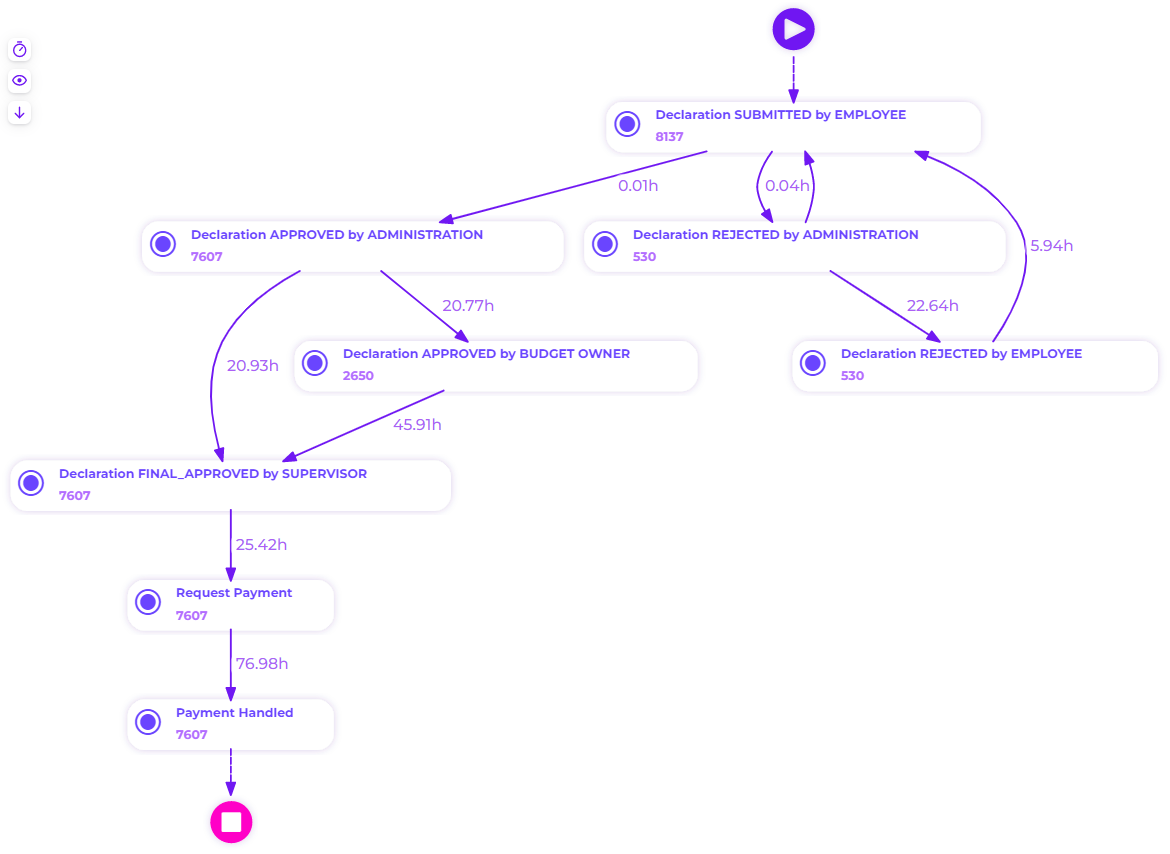
Figure 42. Throughput Time (median) of the top 4 variants
The top 4 variants' process maps and median throughput times are shown in the picture above. Overall, as we can see, the median is significantly shorter than the average. This indicates that there are instances where cases took a very lengthy period, extending the average into days.
To confirm this, we can go back to the throughput time window and retain cases with a very long duration using the slider. In Figure 43, we retain cases that took around 47 - 328 days. These cases exceeded the overall mean and median which were only around 11.47 and 7.81 days. After that, let’s retain the top 4 variants again.
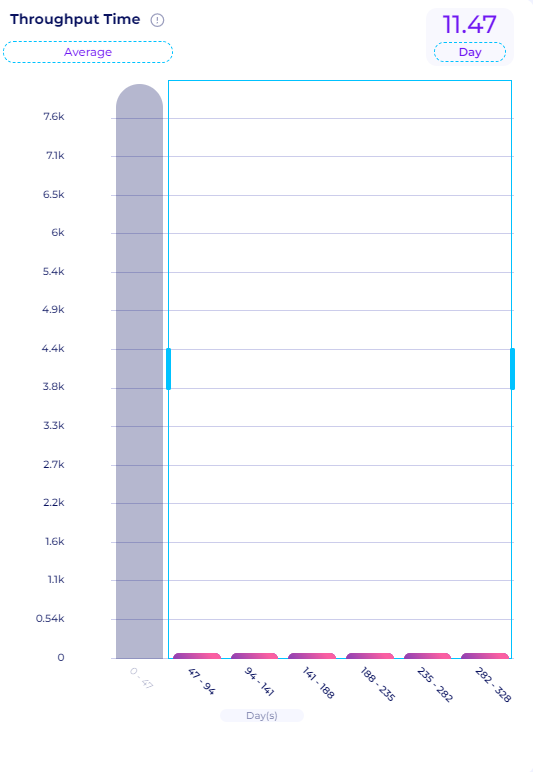
Figure 43. Retain cases with the longest duration
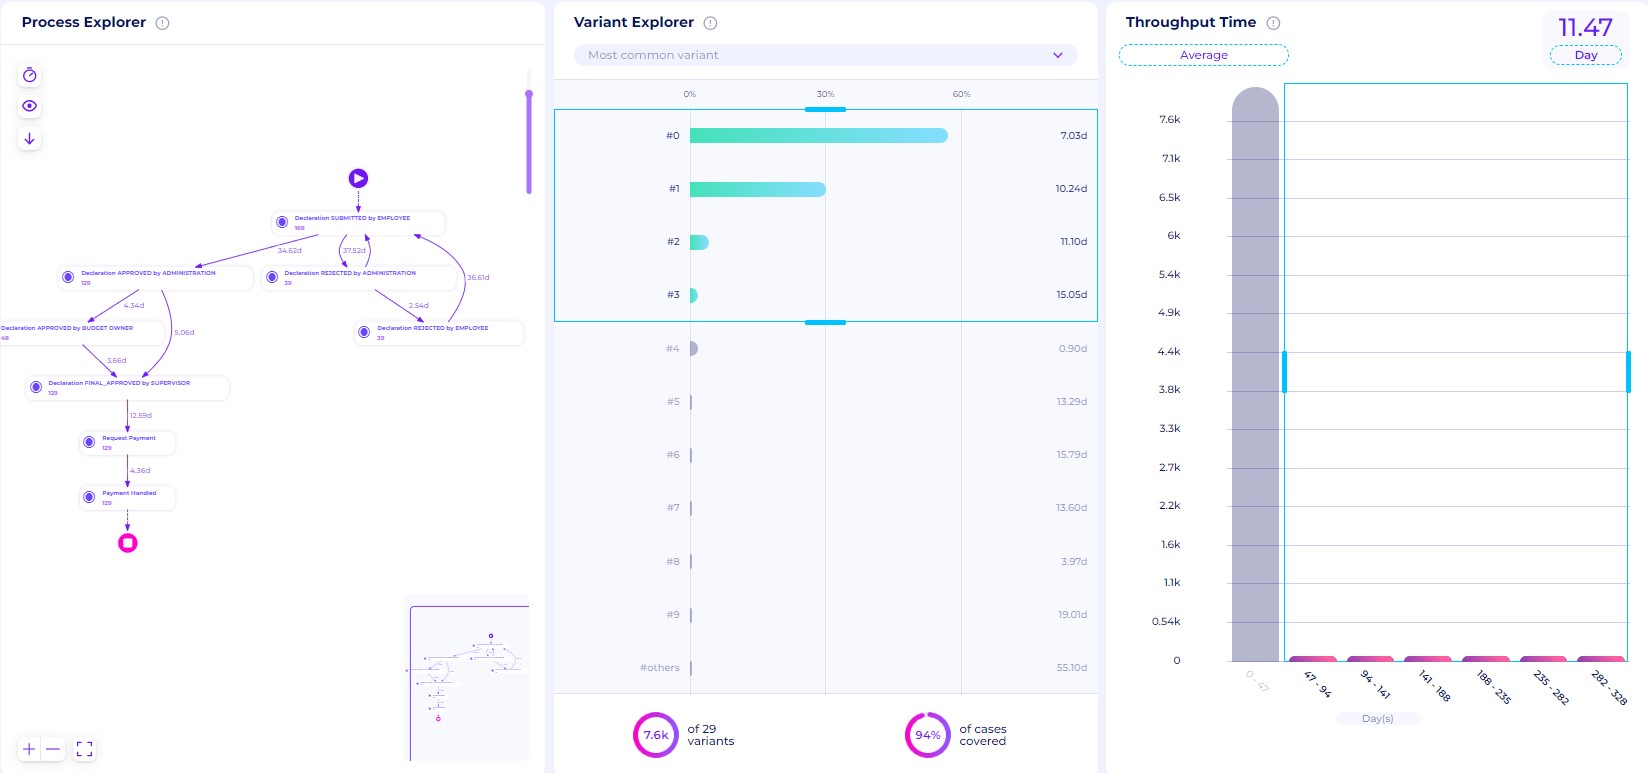
Figure 44. Top 4 Variants of the longest case duration
Figure 44 shows how to retain the top 4 variants of the longest case duration, we can zoom in to the process explorer to observe the process maps.
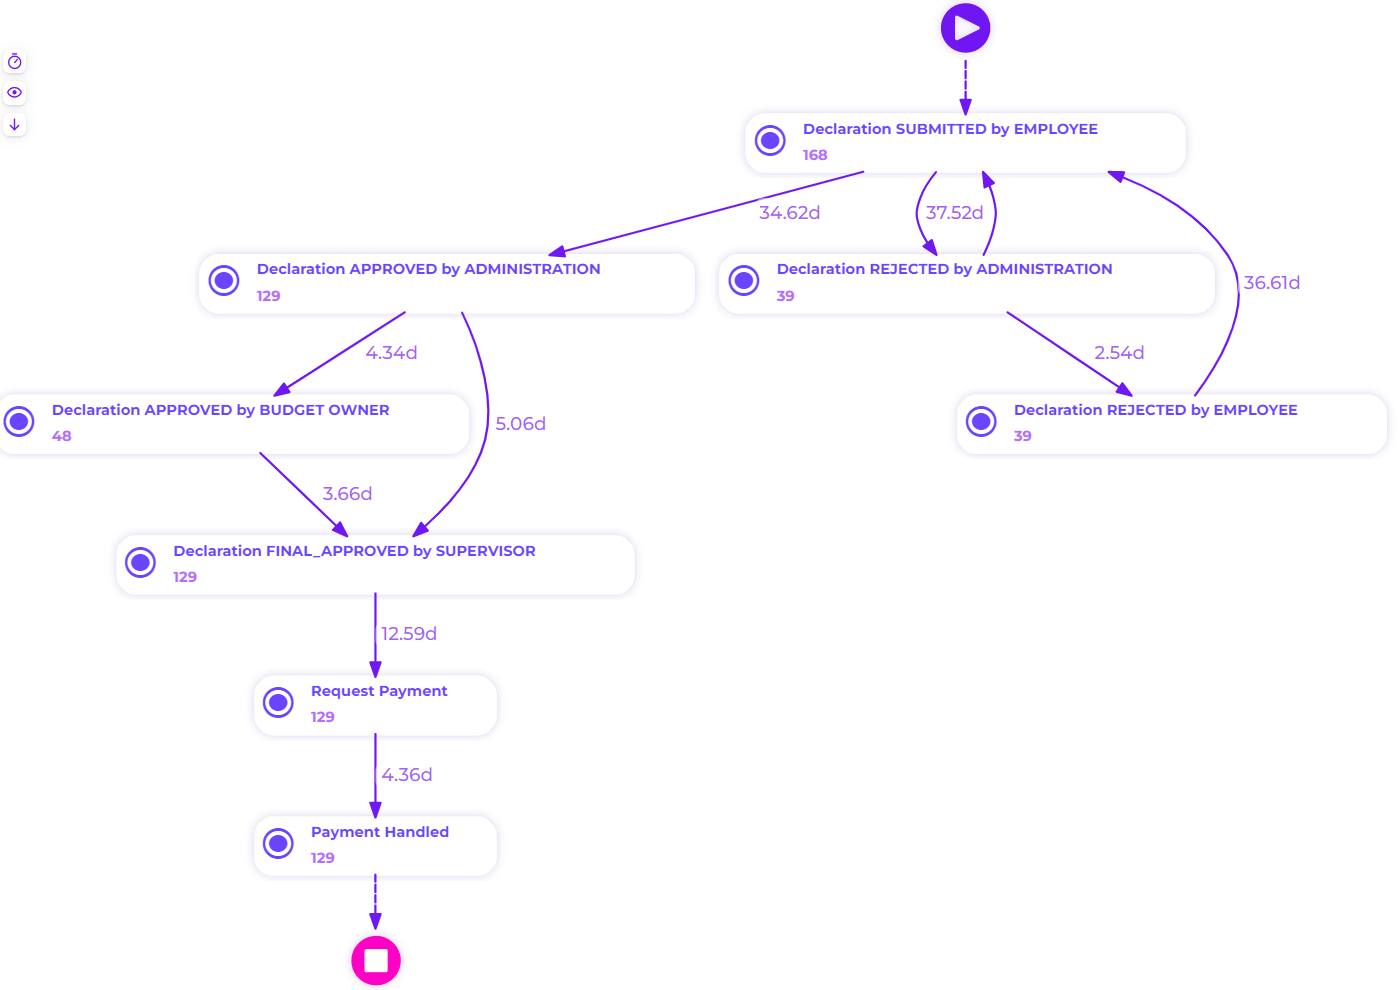
Figure 45. Process maps of the top 4 variants of the longest cases
From Figure 45, we can gain several insights:
Activities that extend the case duration are Declaration REJECTED by Administration with an average of 37.52 days, Declaration APPROVED by Administration with an average of 34.62 days, and rework of Declaration SUBMITTED by Employee with an average of 36.61 days. Again this is consistent with the previous analysis where these three activities also took a really long time. The university needs to take a look at how the declaration is approved by the administration and if this case be automated
Request Payment also takes a long time, around 12.59 days on average. Same to our previous analysis, Requesting Payment and Payment Handled should also be carried out soon after the declaration has been authorized. This waiting period adds nothing to the business process as a whole.
How many travel declarations get rejected in the various processing steps and how many are never approved?
Cases that are left rejected
We can get cases that are rejected with no resubmission by using the activity selection filters.
Open the activity selection filters. Select the Case ends with the option, and pick Declaration REJECTED by Employee, Declaration REJECTED by Administration, Declaration REJECTED by Supervisor, and Declaration REJECTED by Budget Owner. This will retain cases that are left rejected.
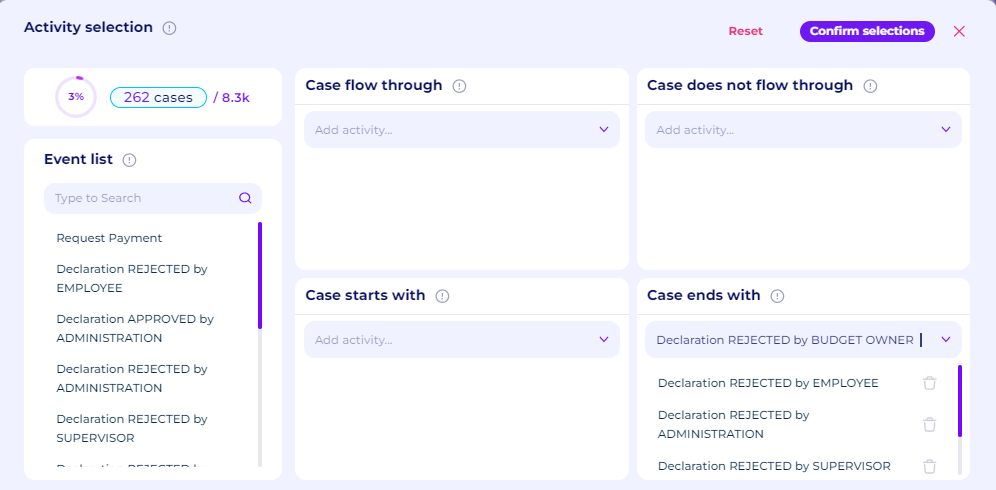
Figure 46. Activity Selection Filters to retain rejected cases
On the discovery tab, select all the variants using the slider in variant explorer.
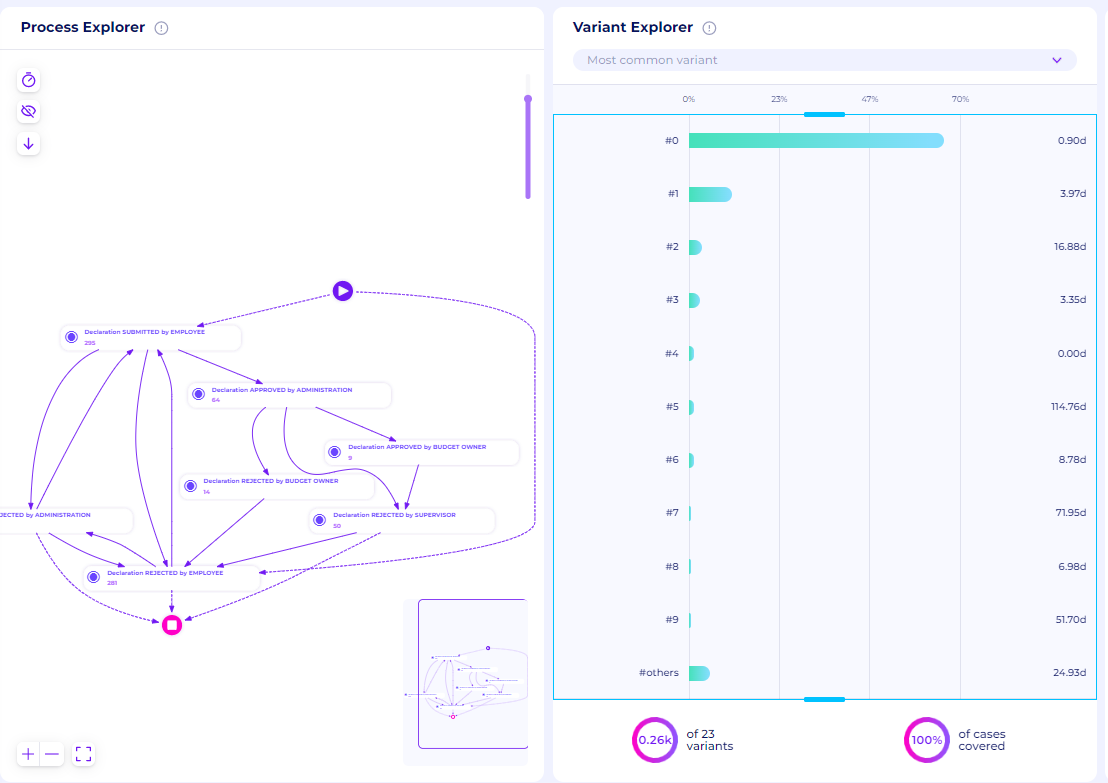
Figure 47. Process Maps for all rejected cases that are left rejected
We can see from the figure above, there are around 260 cases that are left rejected without any follow-up. We can zoom in on the process explorer to get the details. Figure 48 demonstrates that there are a few hundred cases in which the employee never follows up on their declarations. In some instances, the supervisors will reject cases that have been accepted by the administration and budget owner. The majority of instances, however, are simply abandoned by the employee without any further submissions.
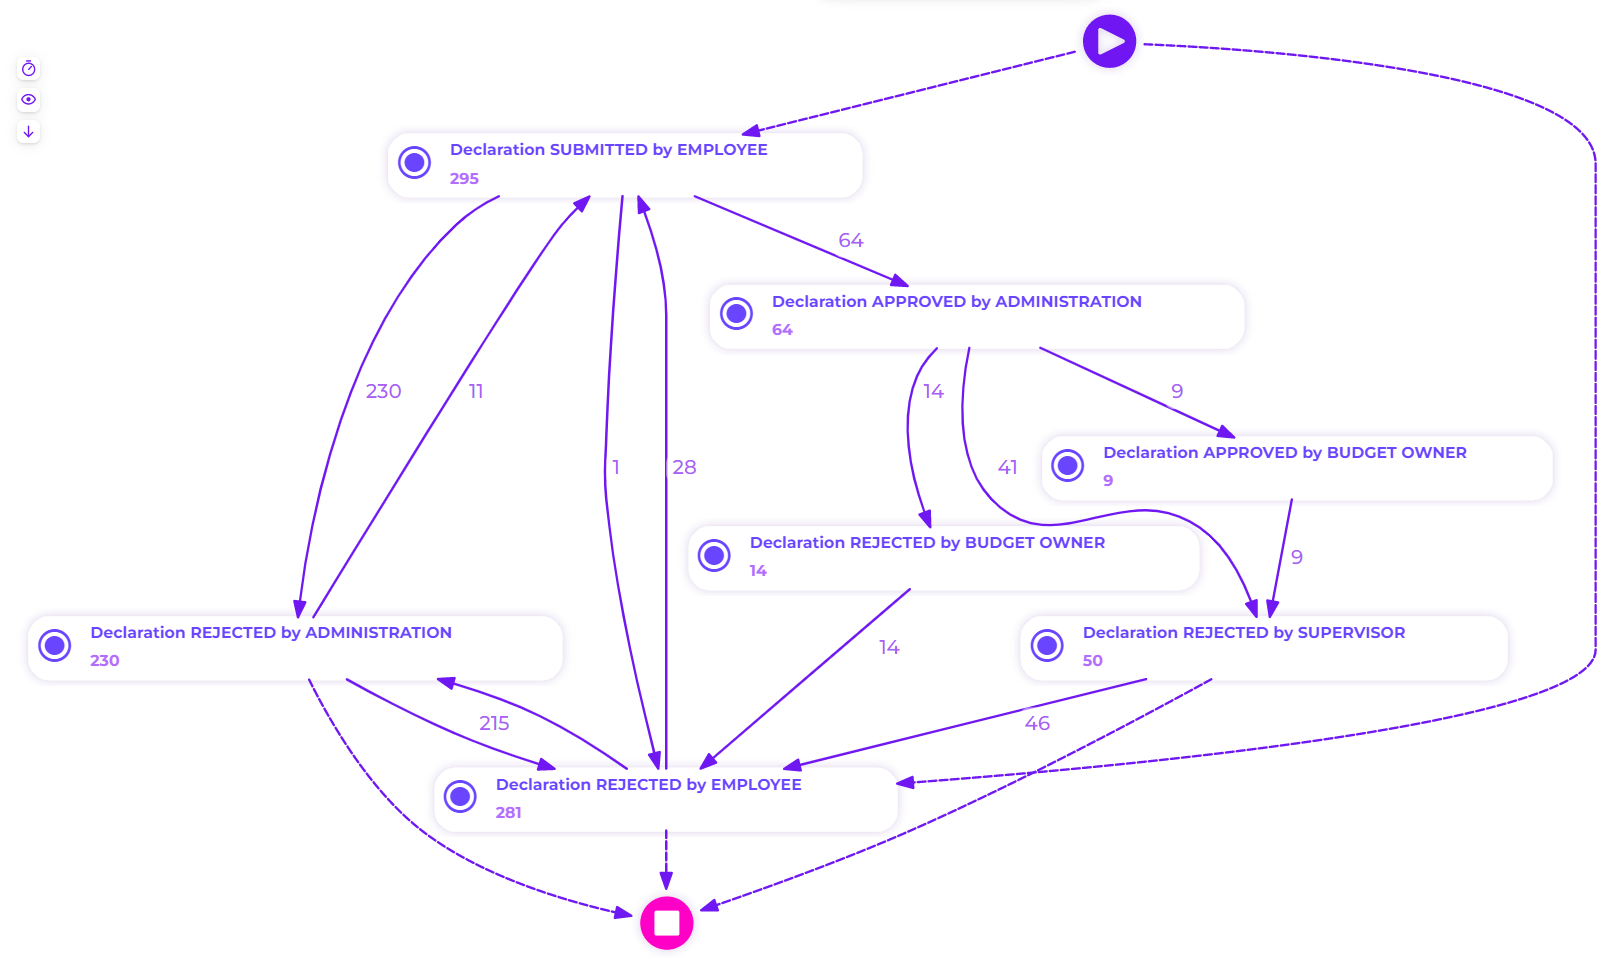
Figure 48. Detailed Process Maps for all rejected cases that are left rejected
Cases without successful payment requests
Another failed case is the one without any payment request, we can use the activity selection filters again.
Open the activity selection filters. Select the Case does not flow through option, and pick Request Payment. Confirm the selection and then open the activity selection once again, select the Case does not flow through option, and pick Payment Handled to be excluded. Perceptif allows multiple filters to be stacked with each other
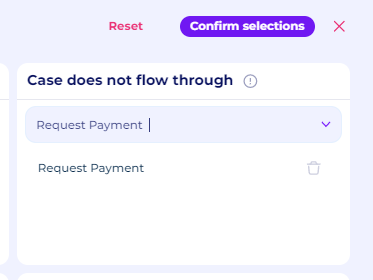
Figure 49. Exclude Request Payment
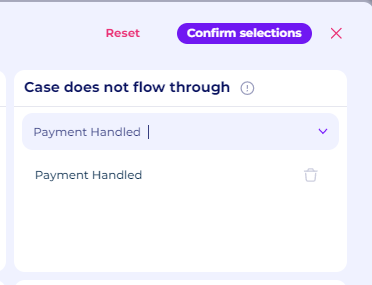
Figure 50. Exclude Payment Handled
From the process discovery tab, if we select all variants, we can see that there are around 360 cases without a successful payment option.
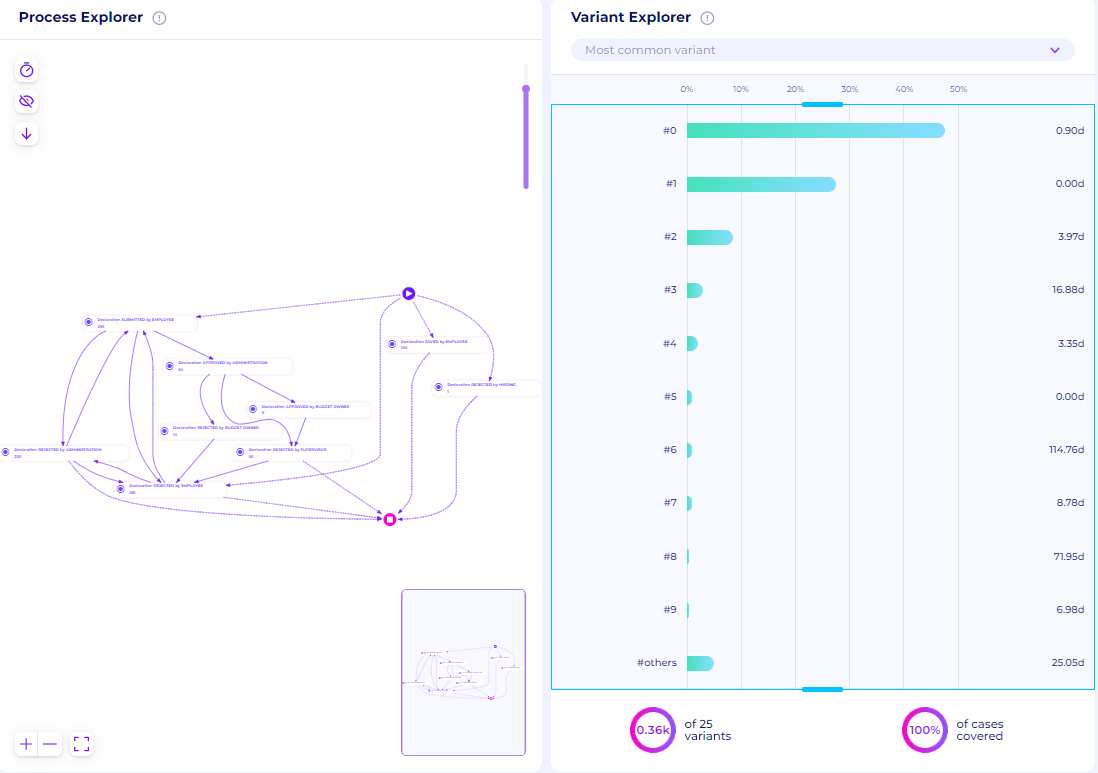
Figure 51. Process Maps of cases without successful payment
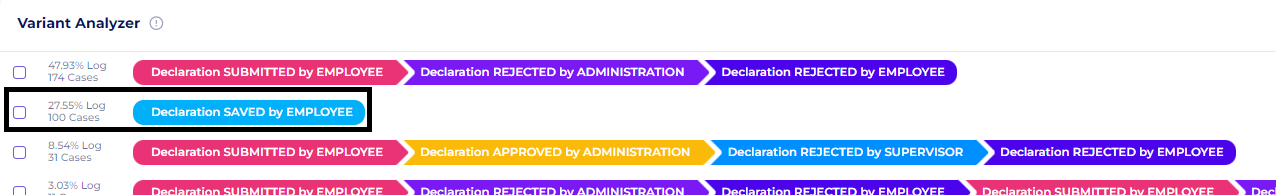
If we take a look at the variant analyzer, we notice that there are cases with only one activity, which is Declaration SAVED by Employee. These are cases that are created by the employee but only saved without being submitted. The university also needs to make sure that cases that are only saved also got a proper follow-up.
Insights and Possible Improvements
From the analysis of the travel reimbursement dataset, we can gain several insights and possible improvements to streamline the process, as follows.
From the variant analyzer, we can easily observe that every rejection activity by the administration, supervisor, or budget owner is always followed by a “Declaration REJECTED by Employee“ activity. This is a sign of redundancy, especially when the case is resubmitted again by the same employee. The “Declaration REJECTED by EMPLOYEE“ activity extends the overall cases for 2.04 - 3.26 days. The university should consider removing this activity to improve efficiency. The university should consider removing this specific activity to cut the case duration.
Declaration REJECTED by Employee, Declaration APPROVED by Administration, and rework of Declaration SUBMITTED by Employee are activities that took the longest throughput time, especially for cases with really long duration. These are activities that are done at the beginning of the case, thus the university needs to consider automated submission checking to cut the throughput time.
We can see that instances that require approval from both the budget owner and supervisors typically take longer to approve than situations that only require supervisor approval. Between Declaration APPROVED by BUDGET OWNER and Declaration APPROVED by SUPERVISORS, there is a particularly long waiting period. This indicates that the supervisors took longer than the budget owner to approve the submissions, and need to be evaluated
Requesting payment and handling payment both took a considerable amount of time. This is not ideal because the payment action should also be carried out soon after the declaration has been authorized. This waiting period adds nothing to the business process as a whole. An ineffective external payment system (accounts payable) could also be to blame for the delay.
There are a few hundred cases in which the employee never follows up on their declarations. In some instances, the supervisors will reject cases that have been accepted by the administration and budget owner. The majority of instances, however, are simply abandoned by the employee without any further submissions. This includes cases that are only saved by the employee with no follow-up. The university should consider use a notification/alarm feature to alert the employee of cases that are only left rejected
All the insights and possibilities for improving the process above can be obtained easily through Perceptif and all the available features. Perceptif easily helps business analysts get these insights without having to create custom formulas or perform special queries.