
Procure to Pay Demo
Introduction
Organizations are increasingly focusing on business processes as technology and enterprise systems develop. Understanding and managing these processes is critical to business efficiency and competitiveness, ensuring companies continuously deliver value.
These business processes are often supported by an integrated enterprise system that records each activity in an event log. Each event in the log can include several attributes such as the timestamp, who performed the activity, what activity was being performed, which cases were affected, and other data that the system can capture.
If analyzed properly, these data points provide valuable insights to let managers and leaders make data-driven decisions.
All businesses have their ideal processes for sales, operations, and other aspects. However, in reality, these processes often deviate from this ideal. Perceptif analyzes such data in real-time, identifying the variances, and presenting the reality.
Now, let’s show you how Perceptif assists companies in gaining valuable insights from your raw event log data by providing real-world examples from a multinational corporation.
About Dataset
Dataset Format
Event data is commonly stored in tables, CSV files (Comma Separated Values), and spreadsheets (like Excel files), where each row or column represents an event. For process analysis using Perceptif, there are 3 main attributes required in your data:
Case Id: Unique identifier of each case in a process.
Events: An activity completed in a single case Id. Each can have multiple Events.
Timestamps: When activity is performed in the system. Event log data can have 2 timestamps - a start (when an event begins) and an end (when it's completed).
Other optional attributes such as case attributes and resources can also help describe the business process.
Dataset Source
The sample data comes from the Business Process Intelligence (BPI) Challenge 2019, an annual business process competition that promotes process mining techniques to researchers and practitioners. The data records a Purchase-To-Pay (P2P) process of a large multinational company in the Netherlands that operates in the area of coatings and paints.
For this demo, we look into purchase case data between January - June 2018. Download the dataset that is used in this demo here.
The purchase-to-pay process starts when a company employee decides a specific good or service needs to be obtained. Once the good or service has been provided and paid for, the process is complete.
The process includes obtaining estimates, approving the purchase, selecting a supplier, issuing a purchase order, receiving the goods (or service), and paying its invoice.
In B2B transactions, a procure-to-pay process can be thought of as the opposite of a quote-to-cash process. On the supplier’s end, there is a comparable quote-to-cash process for each procure-to-pay process.
Dataset Attributes
Below is a description of the many data attributes for our analysis.
Attributes | Description |
case_id | A combination of the anonymized purchase document id and the anonymized item ID |
activity | The name of activities done in a case_id |
start time | The timestamp when activity was started |
end time | The timestamp when activity has finished |
purchasing_document | The anonymized purchasing document ID |
item | The anonymized item ID |
item_type | The type of the item |
GR_Based_Inv_Verif_ | Flag indicating if GR-based invoicing is required |
Goods_Receipt | Flag indicating if 3-way matching is required |
source | The anonymized source system of this item |
Purch_Doc_Category_name | The name of the category of the purchasing document |
company | The anonymized company subsidiary where the purchase originated |
vendor | The anonymized vendor to which purchase document was sent |
vendor_name | The anonymized vendor name |
Item_Category | The category as explained above (3-way with GR-based invoicing, 3-way without, consignment). |
resource | The user/system name performing the activity |
Document_Type | The document type |
Cumulative_net_worth_EUR | The purchase value (in EUR) |
Spend_classification_text | A text explaining the class of purchase item |
Spend_area_text | A text explaining the area for the purchased item |
Sub_spend_area_text | Another text explaining the area for purchased item |
Main Questions
The company’s process owner seeks answers to these questions:
Q1. Are there process models that accurately depict the process in this data?
Q2. What is the throughput of the invoicing process, i.e. the time between goods receipt, invoice receipt, and payment (clear invoice)?
Q3. Which Purchase Documents stand out from the log? Where are deviations from the processes discovered and how severe are these deviations?
P2P Process: 3 Categories
Currently, the organization lacks a clear understanding of the P2P process within its system.
Despite this, they do have a set of fundamental regulations governing the P2P process, which are determined by the classification of each case below:
3-way matching, invoice after goods receipt
For these items, the goods receipt message value should be matched against the invoice receipt message value, and the value put during the item creation (indicated by both the GR-based flag and the Goods Receipt flags set to true).
3-way matching, invoice before goods receipt
Purchase Items that require a goods receipt message, while they do not require GR-based invoicing (indicated by the GR-based IV flag set to false and the Goods Receipt flags set to true). For such purchase items, invoices can be entered first but blocked until goods are received. Unblocking is done by a user, or by a batch process at regular intervals. Invoices should only be cleared when goods are received and the value matches the invoice and its value at the item’s creation.
Consignment
For these items, there are no invoices on the PO level as this is handled fully in a separate process. Here we see GR indicator is set to true but the GR IV flag is set to false also we know by item type (consignment) that we do not expect an invoice against this item.
The product is received and stored in the warehouse, but not paid for until only after it has been used for production. Since invoices are handled in a different process, the data do not contain information about their invoices
The data context can be better understood now, which is useful for our analysis later.
Importing Data
Before analysis, we import the dataset as a new stream to Perceptif.
Click the “Create New Stream” button in the top right corner
Figure 1. “Create New Stream” button
A new window will appear as below. Drag and drop the file to the box, or click to browse files. Since our dataset is in CSV format, directly drag and drop the file.
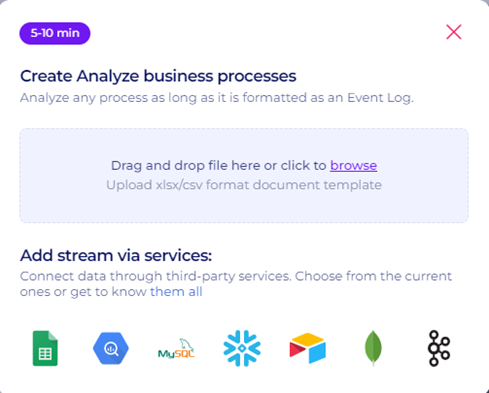
Figure 2. Drag and Drop box to upload new stream
After uploading, assign the Case, Event, Start Timestamp, and End Timestamp according to their respective columns. Add data description (optional) and assign data stream to a team and project. Click “Confirm Selection” to finish.

Figure 3. Configuration of the stream page
Process Discovery (Q1)
After uploading, Perceptif automatically detects all possible flows in the data. These flows are called Variants. There are 3 main windows to view, as below:
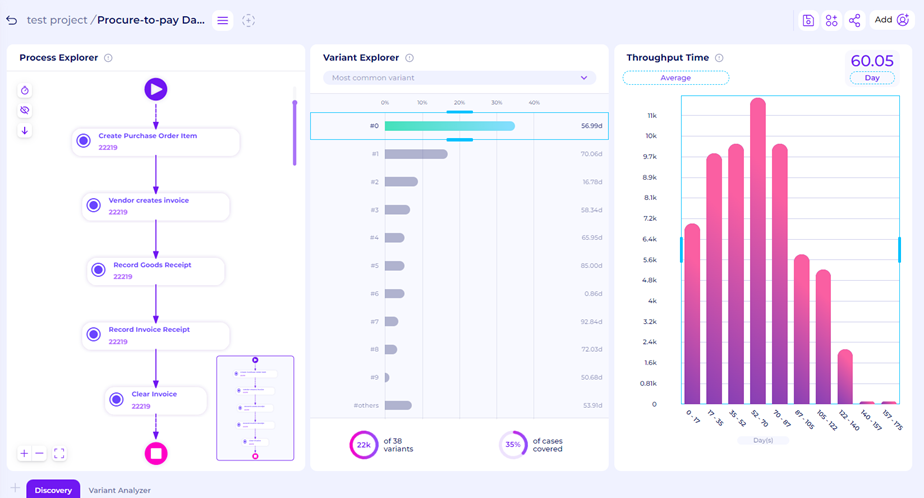
Figure 4. Main Page of the process discovery
On the left is Process Explorer, this window displays process maps of variants selected in the middle window.

Figure 5. Process Explorer Window
In the middle is Variant Explorer, a window that shows the list of process paths in order of most to least common.
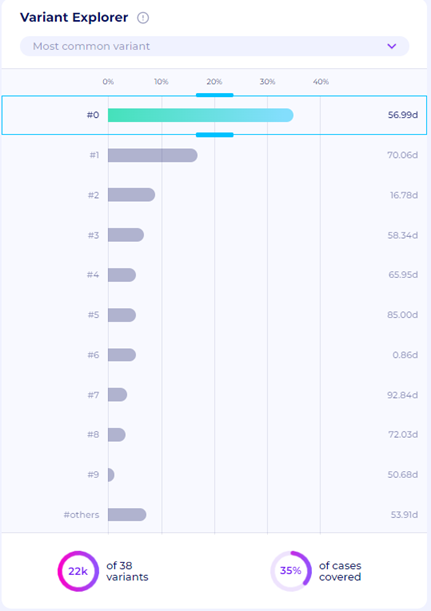
Figure 6. Variant Explorer Window
On the right window is Throughput Time, a graph that shows the case duration in data.
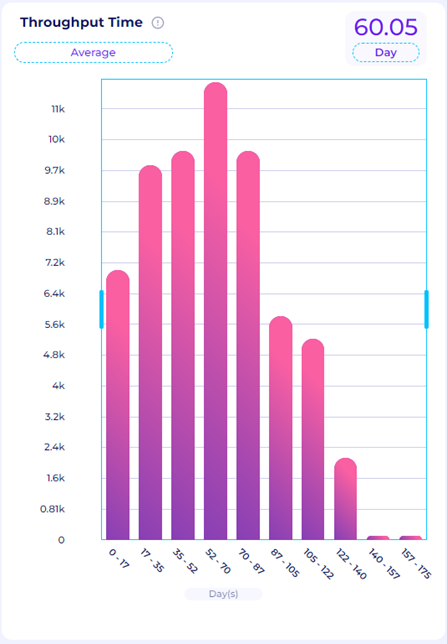
Figure 7. Throughput Time Window
Variants In The Data
Perceptif automatically detects all the process paths within the data; we call these Variants. Ideally, businesses want processes to have minimal variants to minimize deviation and increase efficiency. In reality, processes can have hundreds of paths and variations.
The various variants can indicate uncontrolled processes, fraud, and/or inefficiency.

Figure 8. The number of variants
Based on Figure 8 in the Variant Explorer, we can see that there are 38 variants here.
This shows that there are multiple process flow variations in this dataset. As previously detailed, the organization divides each purchase case into 3 main categories. Thus, they expected to see about 3 variants. In reality, 38 process flow variations emerged. We will analyze this further later. Now, let’s check three of the most common variants. To do that, use the slider in the Variant Explorer. By default, it shows the most common variants.
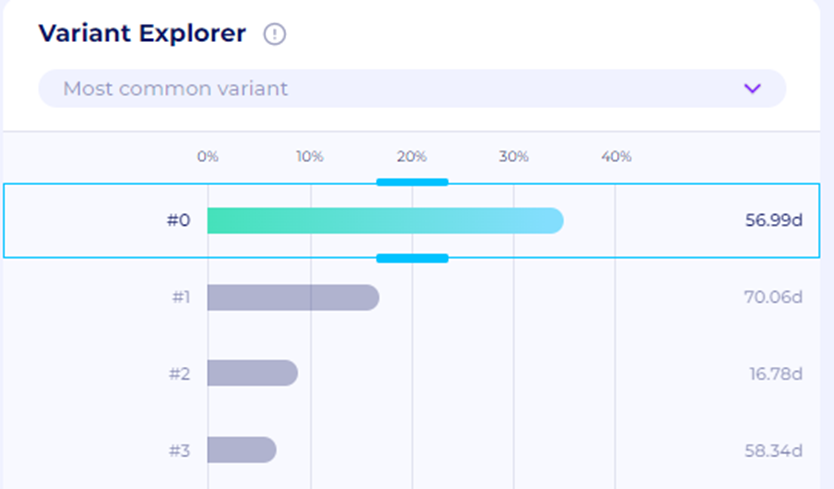
Figure 9. Use Slider to select the most common variants
Variant #0
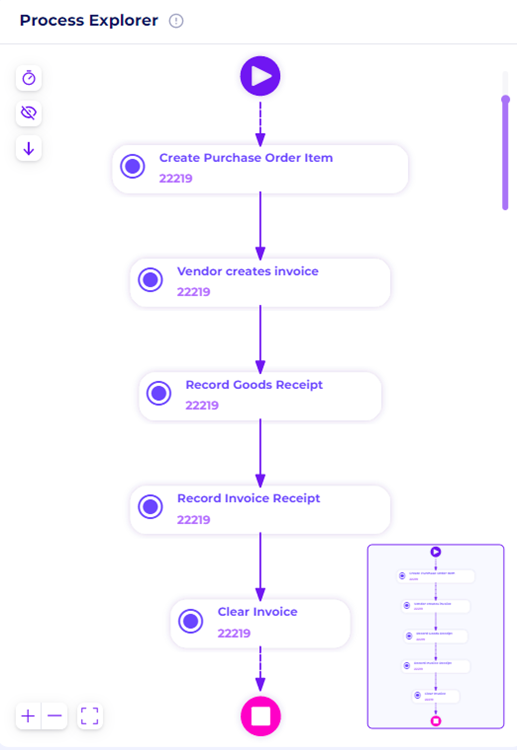
Figure 10. The Process Flow of Variant #0
The process map in Figure 10 above shows the path of the most common variant.
This variant charts 5 activities and 22,219 cases.
Variant #1
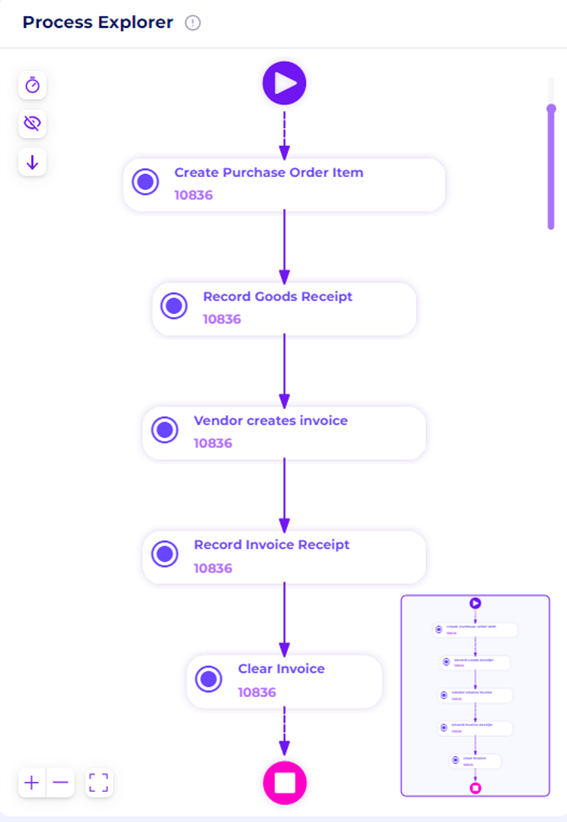
Figure 11. The Process Flow of Variant #1
Similarly, this variant also has 5 activities with 10,836 cases. The flow is also similar except the Records Goods Receipt is done first before Vendor creates the invoice.
Variant #2
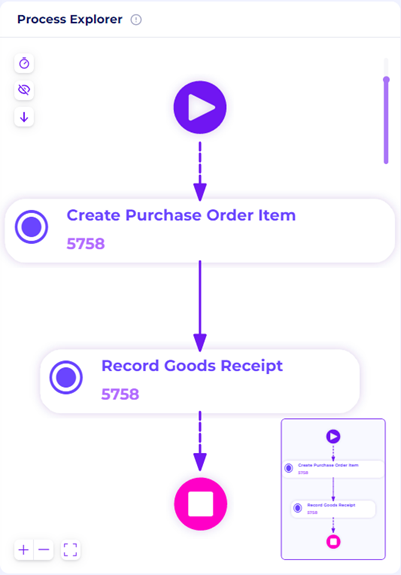
Figure 12. The Process Flow of Variant #1
In this variant, we see only 2 activities: “Create Purchase Order Item“ → “Record Goods Receipt“. This shows ongoing cases in the dataset, where the purchased item is received, but no invoice is created/received yet. There are 5,758 cases here.
Variant Analyzer
We can also check all the other variants. To do this, click the Variant Analyzer tab at the bottom of the page, right next to the Discovery tab.
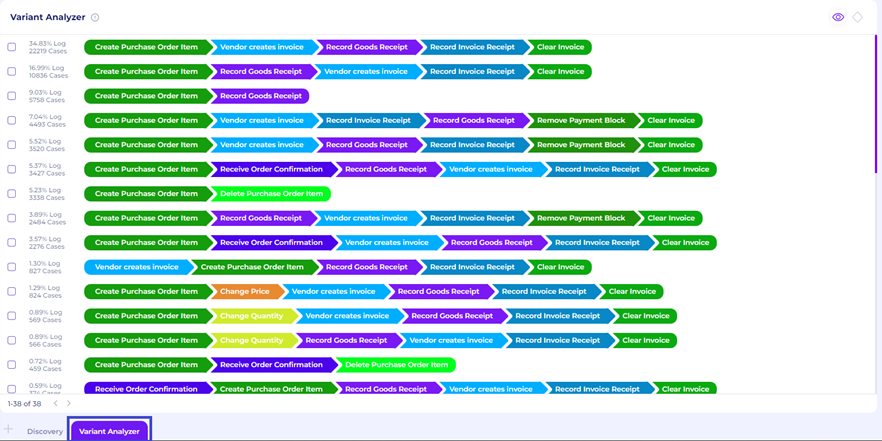
Figure 13. Variant Analyzer Tab
The Variant Analyzer tab shows all the process maps of every variant, the number of cases in each variant, and also the total percentage. This is an easy way to see the general flow of all the cases in the dataset. Users can see which variant is ideal and which needs more attention, especially the one that doesn’t conform to the standard.
Discovering The Process Model
In Q1, process owners want to know the collection of process models that accurately describes the data. Perceptif answers this by displaying process maps of all the different variants in the Variants Analyzer. However, as seen above there are a total of 37 variants, which shows variations of non-ideal cases detected.
As a start, we can try to define the ideal variant/process models. After establishing this, we can detect which variants do not conform to the standard. To do this, we combine our process knowledge of the 3 categories of the P2P process and the actual process maps. To drill down the process, we can use Perceptif’s filter feature.
A good process model should be simple, precise, and fit the observed behavior in the log. As such, we want a high but not maximum precision in the process model to keep it simple.
A process model should be based on completed cases, so incomplete ones will be filtered out. For 3-way matching, invoice after goods receipt, and 3-way matching, invoice before goods receipt, complete cases are indicated with the activity “Clear Invoice“
Here are the ideal variants for each purchasing category:
3-way matching, invoice after goods receipt
To see this process flow, we utilize the Filter feature. Select a filter by clicking the round “+” button at the top of the Process Explorer window.
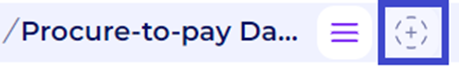
Figure 14. Filter Button
The “Attribute selection“ filter helps select cases based on specific attributes.
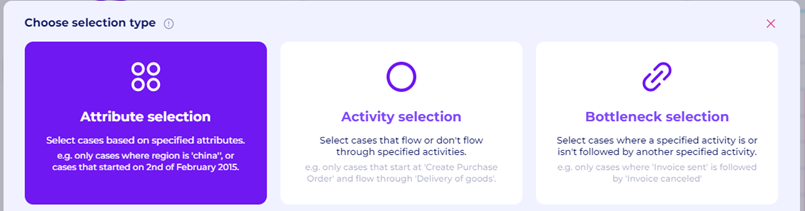
Figure 15. Attribute Selection Filter
Each row in the data has “Item Category“ attributes which define the purchasing cases category. Select “3-way matching, invoice after goods receipt” cases by checking its box in the Item Category column. After that, confirm selections.
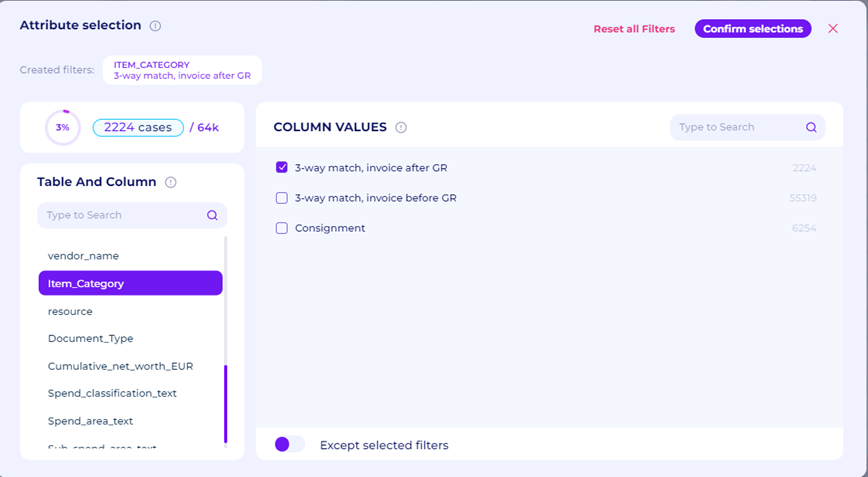
Figure 16. Item Category Filter
Next, we will only retain completed cases where invoices are cleared. The activity selection filter allows us to retain cases based on whether a specific activity is done within the case. After that, click the “Confirm Selection” button to finish.
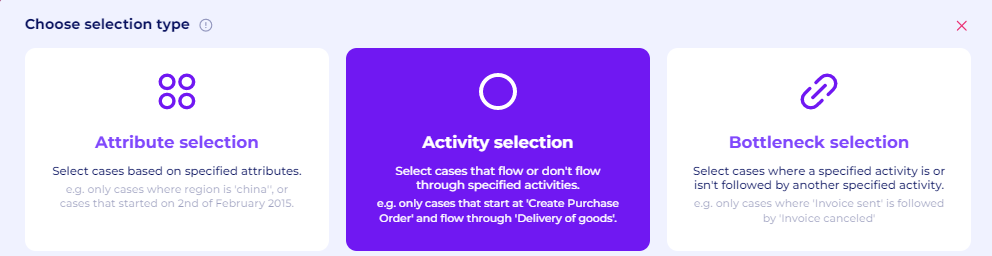
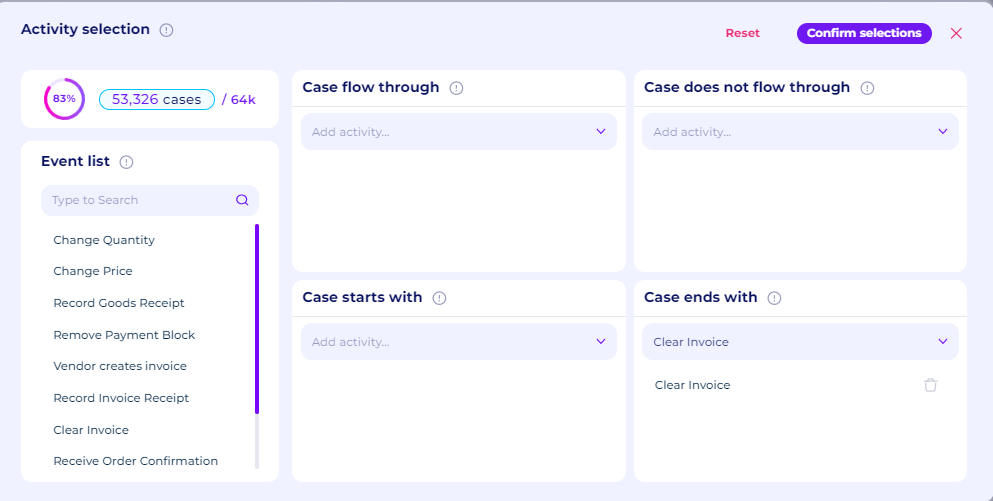
Figure 17. Activity Selection Filter
We can check its details in the Variant Analyzer tab.
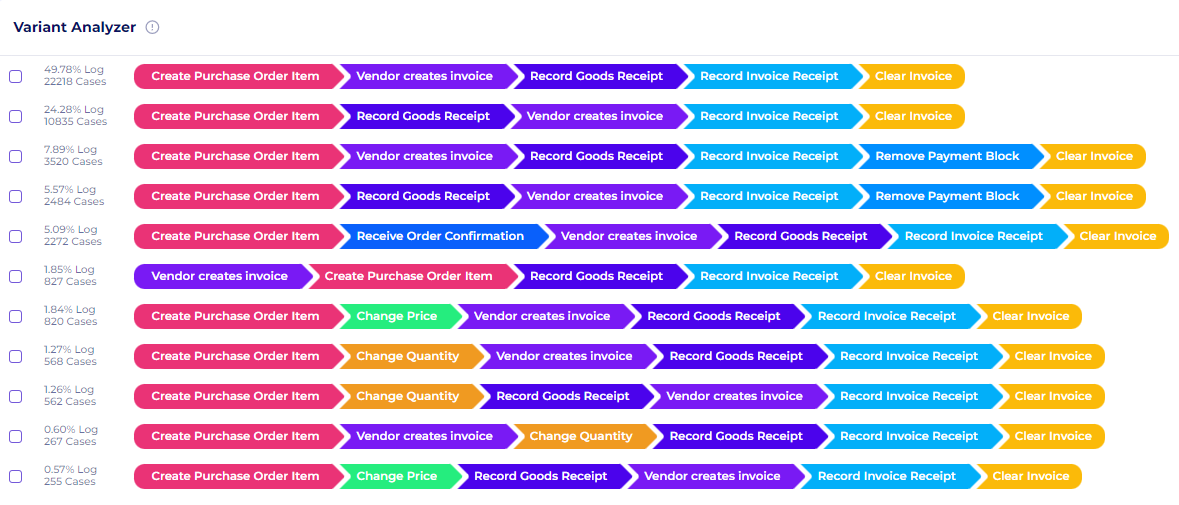
Figure 18. Variant Analyzer of the “3-way matching, invoice after goods receipt”
In total, we can see that there are 11 variants for this category’s cases. This means that there are several non-ideal variants in existence.
The “3-way matching, invoice after goods receipt” category only records invoices after the receipt of the goods is documented. Thus, the activity “Remove Payment Block” should not exist in this category. To validate this, let’s examine this category’s 2 most common variants in the Process Explorer. Go back to the discovery tab, and use the Variant Explorer slider.
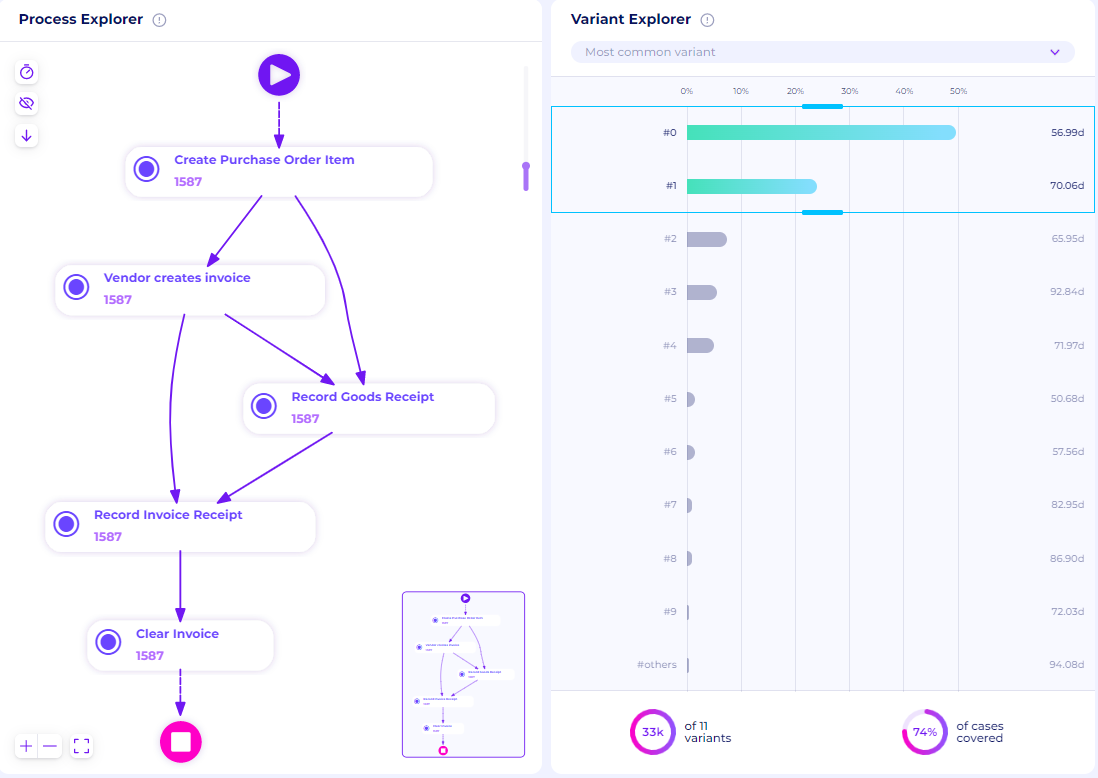
Figure 19. Top 2 variants of the “3-way matching, invoice after goods receipt”
The 2 most common variants cover around 74% of this case type, which shows pretty good precision. We can see that the “Record Invoice Receipt“ is always done after the “Vendor Creates Invoice“ and “Records Goods Receipt“. This can be the ideal process model for this category because it fits the definition and covers more than half the cases.
We can redraw this category on Perceptif’s Whiteboard. To do that, click on the “+” next to the Discovery tab, and then select “Create new page”.

Figure 20. Create a new page
Select the Whiteboard option to create a new whiteboard tab.

Figure 21. New tab options
To start drawing, click the Edit button at the top right. Then, use available tools to illustrate the process model.

Figure 22. Edit Button on the whiteboard
Below is a sample redrawing of this category’s process model.
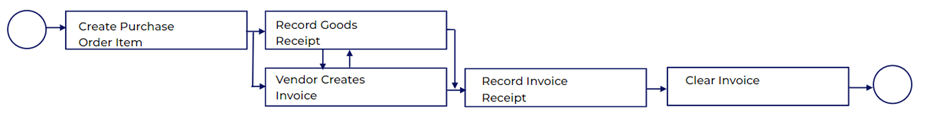
Figure 23. Process Model for the Category “3-way matching, invoice after goods receipt“
3-way matching, invoice before goods receipt
Similar to the above, select “3-way matching, invoice before goods receipt“ in the Attribute selection. To create the process model, we focus only on completed cases
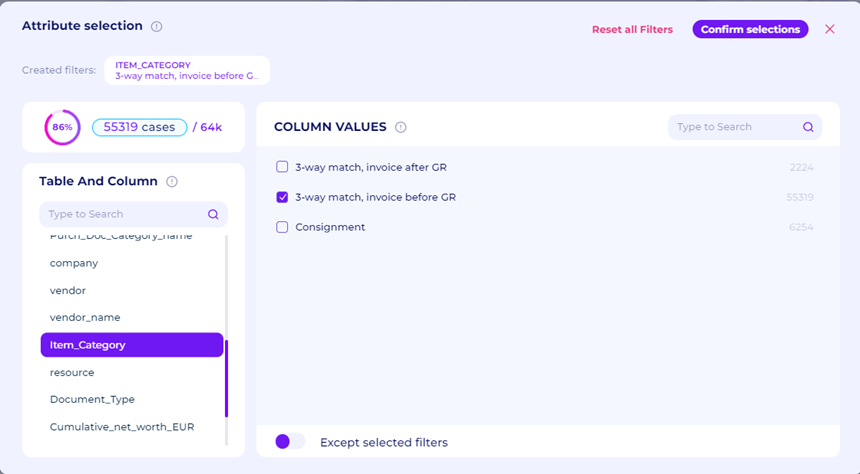
Figure 24. Item Category Filter
Figure 25. Activity Filter
We can check its details in the Variant Analyzer.
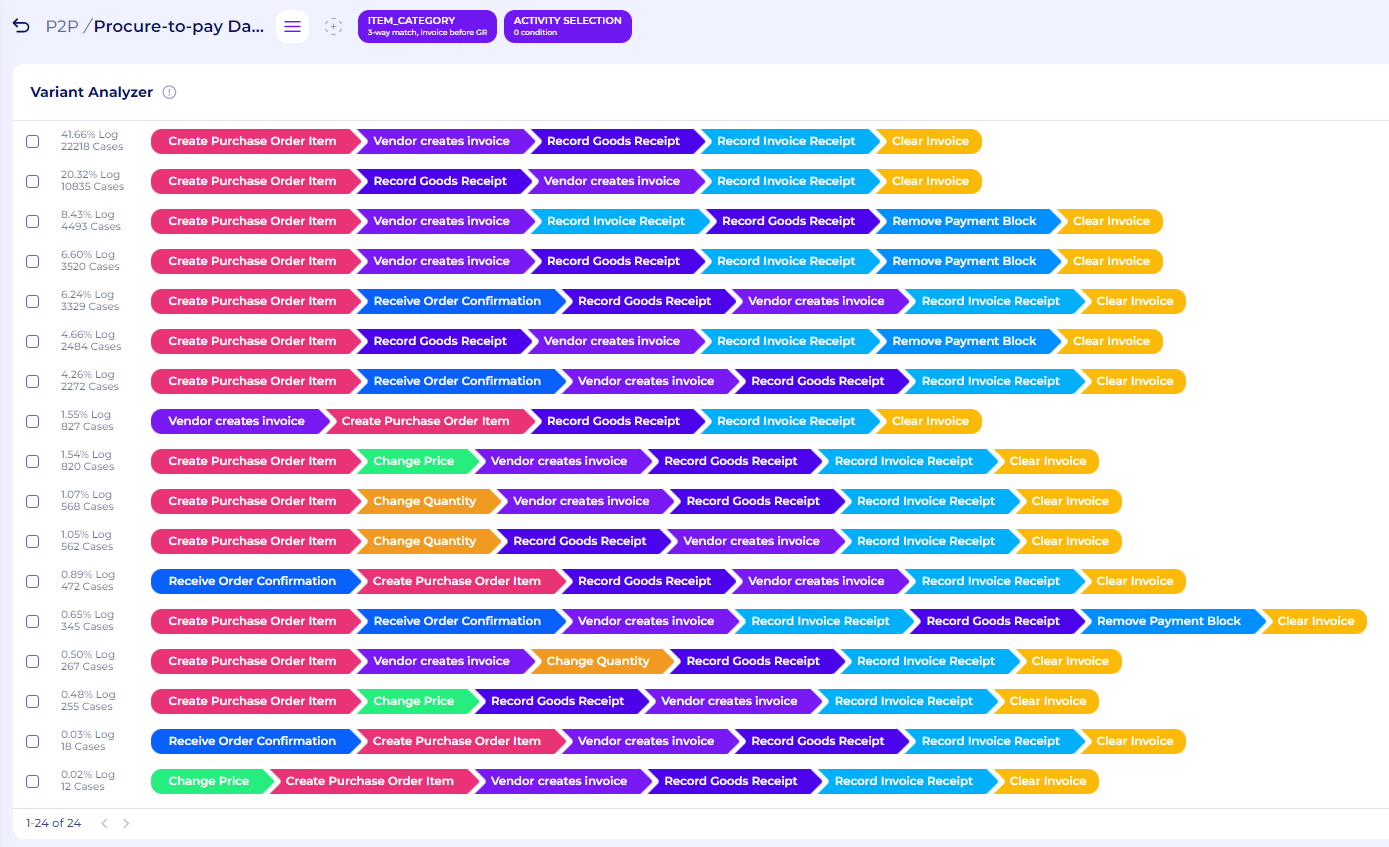
Figure 26. Variant Analyzer of the “3-way matching, invoice before goods receipt”
In total, we can see that there are 24 variants for this category’s cases. This means that there are also several non-ideal variants in existence.
By definition, the “3-way matching, invoice before goods receipt“ category can record invoices before or after the goods are received. If the invoices are recorded before the goods are received, then the payment must be blocked until the goods have been received, as indicated by the “Remove Payment Block” activity. Only then the invoice can be paid after removing the payment block
To validate this, let’s check this category’s top 3 variants. To do this, we can use the slider in Variant Explorer. One additional note, we can select the abstraction of our process model by moving the slider on the right of the Process Explorer window. If the slider is put on maximum, it removes the outlier flows. When it’s put on minimum, it retains all process model flows. Try matching the slider with the following figure to get the same process maps.
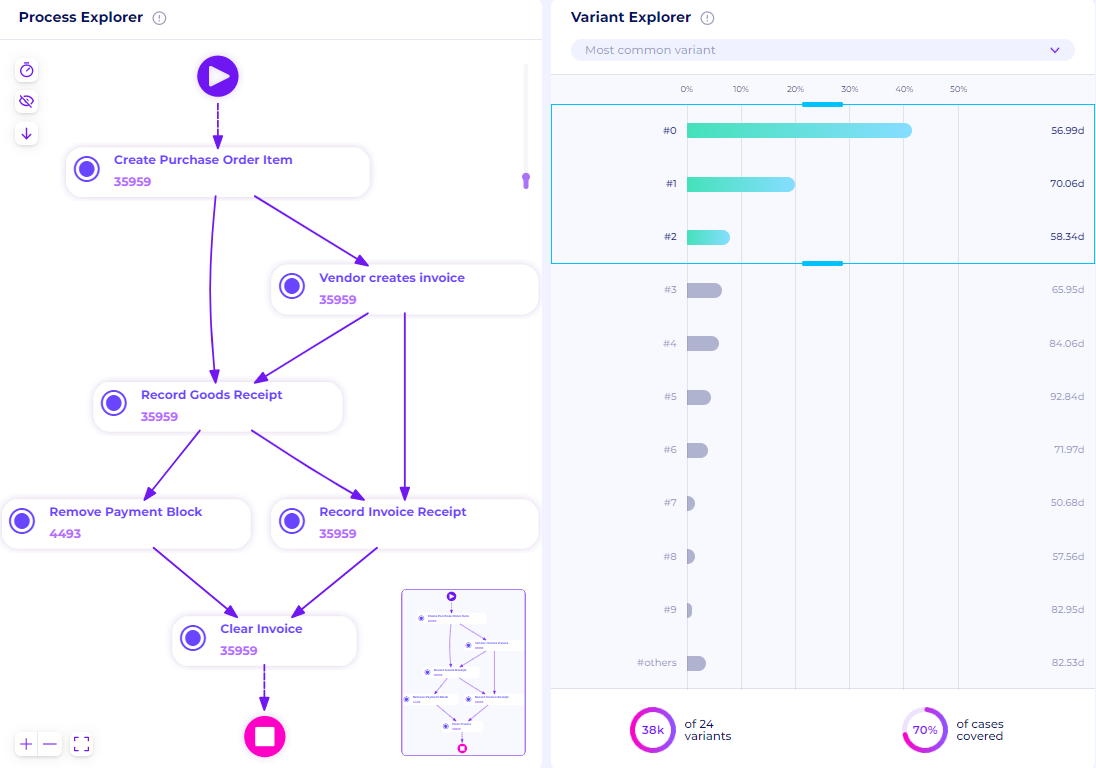
Figure 27. Top 3 variants of the “3-way matching, invoice before goods receipt”
This category’s 3 most common variants cover around 70% of this type of case. We can see that the flows are similar to the previous category, but there’s one additional activity - “Remove Payment Block“ - for the invoice to be paid. We can redraw the process model on Whiteboard as below.
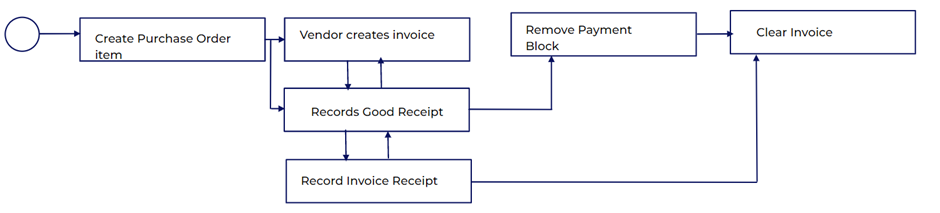
Figure 28. Process Model for “3-way matching, invoice before goods receipt”
Consignment
Just like above, select “Consignment“ in the Attribute selection. For this category, the completed cases are the ones with the “Record Goods Receipt“ activity.
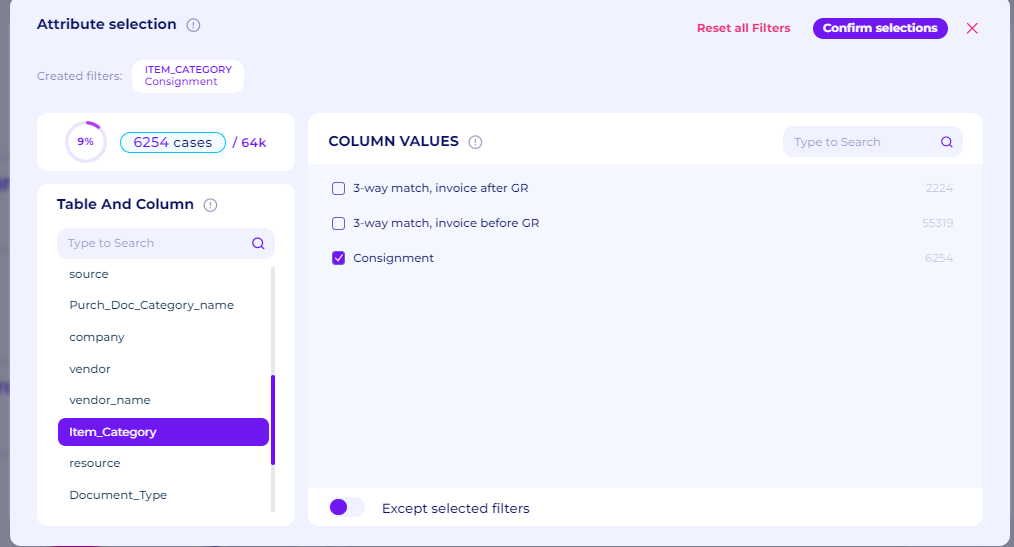
Figure 29. Item Category Filter
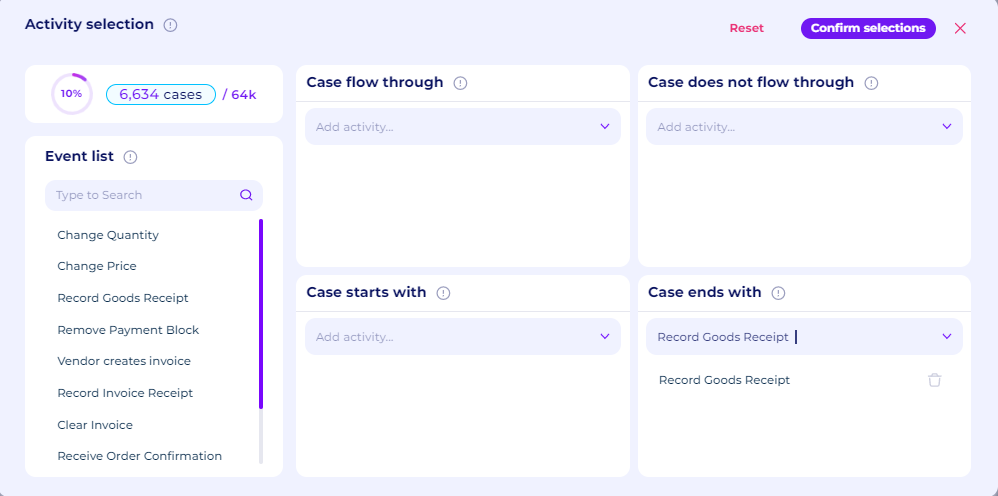
Figure 30. Activity Filter
As we can see, “Consignment“ has 6,086 cases - 9% of the dataset’s total cases. We can check its details in the Variant Analyzer.
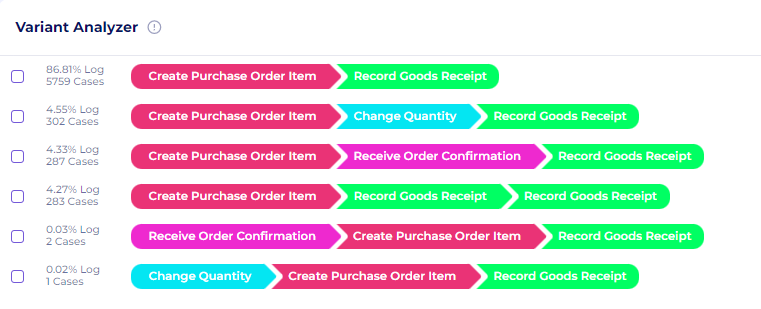
Figure 31. Variant Analyzer of the “Consignment”
In total, we can see that there are 6 variants for this category’s cases. This means that there are also several non-ideal variants here.
By definition, the “Consignment“ category can receive goods in the warehouse and is paid only after usage. The actual product usage is not part of its process log.
To validate this, we can check the top variants in “Consignment“
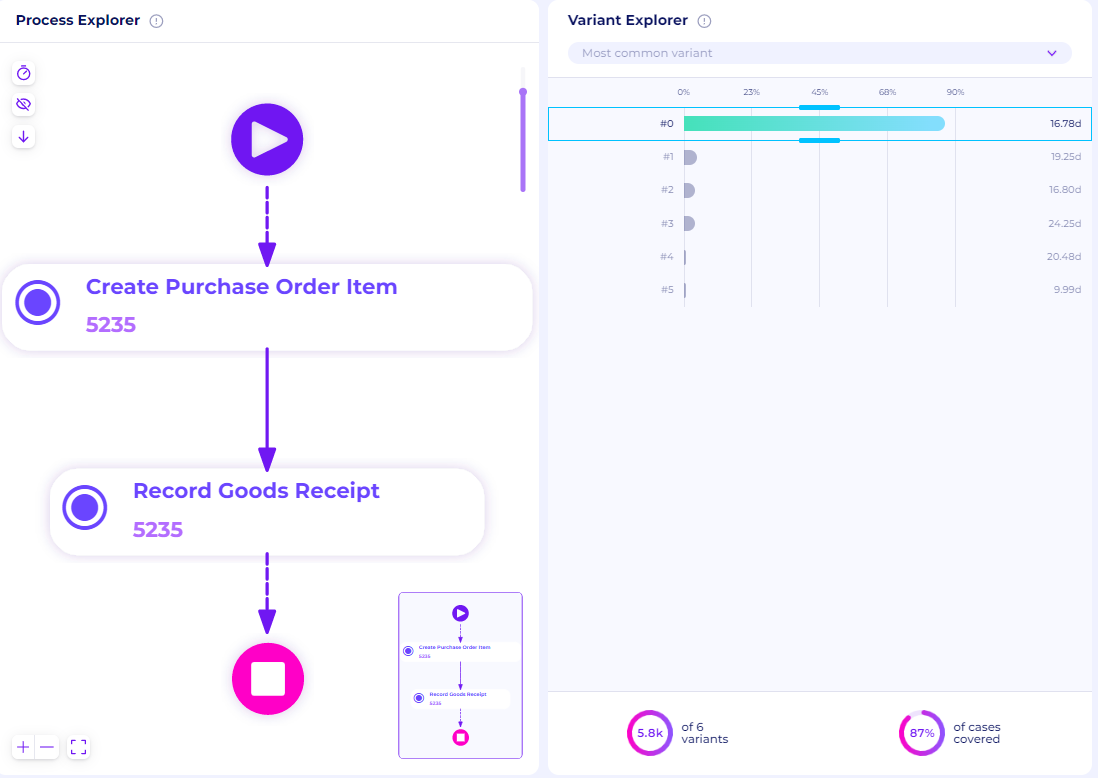
Figure 32. The top variant of the “Consignment”
As seen, there are only 2 main ideal activities, which are where the PO is created and records the receipt of the goods in the warehouse. This covers 87% of Consigment cases
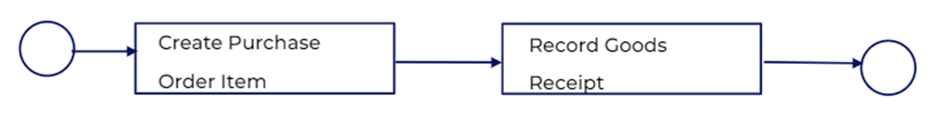
Figure 33. Process Model for “Consignment”
Create BPMN Model
After figuring out the actual model found in the dataset, we can create a business process model and notation (BPMN) to represent the process maps. This BPMN model can be integrated later as a part of the dashboard/visualization and conformance.
Select the process canvas option after clicking the new tab icon
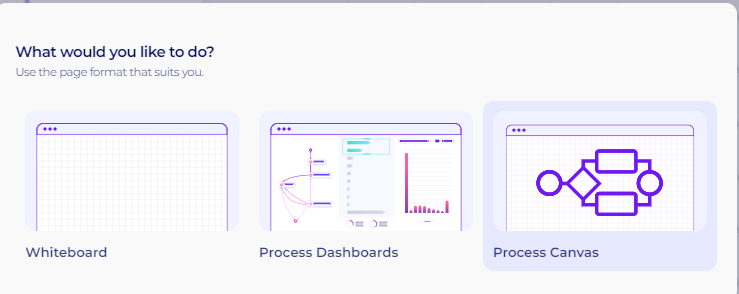
Figure 34. Process Canvas Options
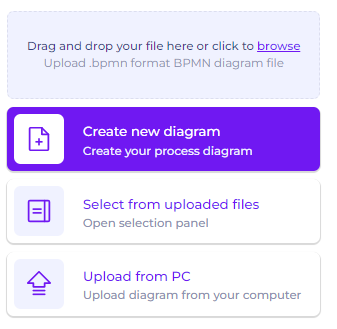
Figure 35. BPMN tab options
A new tab will open with three options. Users can create new diagrams, select from previously uploaded diagrams, or upload from PC. Since we’re going to create a new diagram from scratch, select the first option
A new blank page will be shown in the tab. To start editing, click the edit button at the bottom left of the page

Figure 36. Edit Button in the BPMN tab
The BPMN tools will be available and can be used directly. The following is an example of drawing the ideal process map that we found from the process maps as a BPMN model
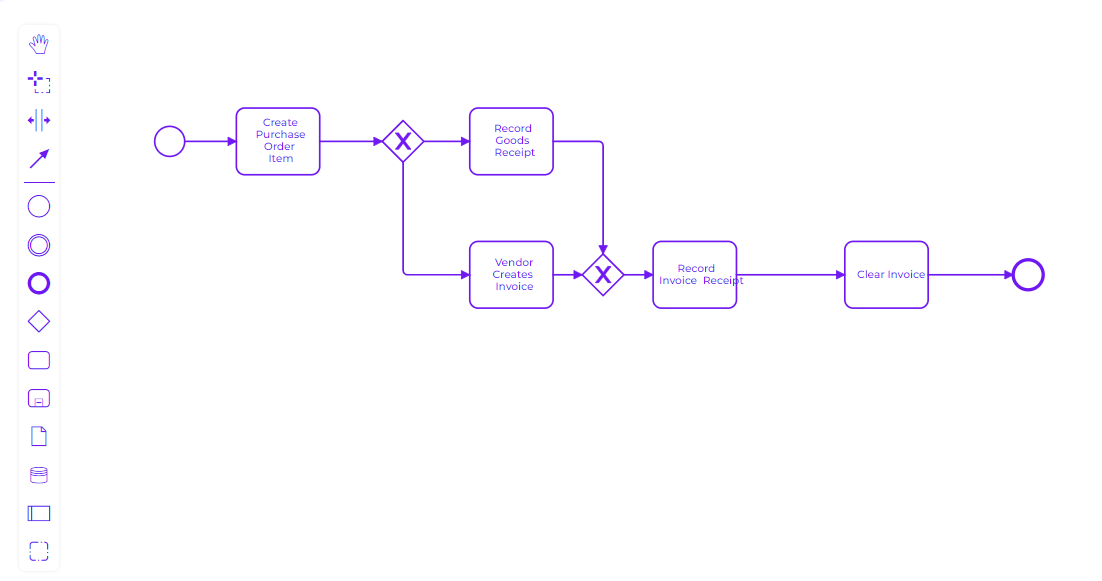
Figure 37. Drawing the BPMN model
We can also save the BPMN files as BPMN, download it as SVG image, or print it as a PDF

Figure 38. BPMN model of 3-way matching, invoice after goods receipt
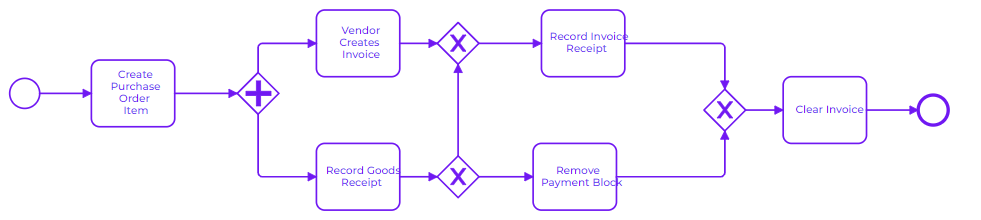
Figure 39. BPMN model of 3-way matching, invoice before goods receipt
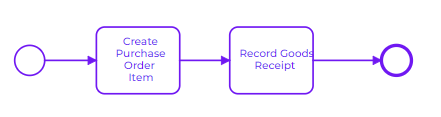
Figure 39. BPMN model of Consignment
Throughput Time (Q2)
The second main question is about the dataset’s throughput.
To check the total throughput time, view the Discovery tab on the Throughput Time window.
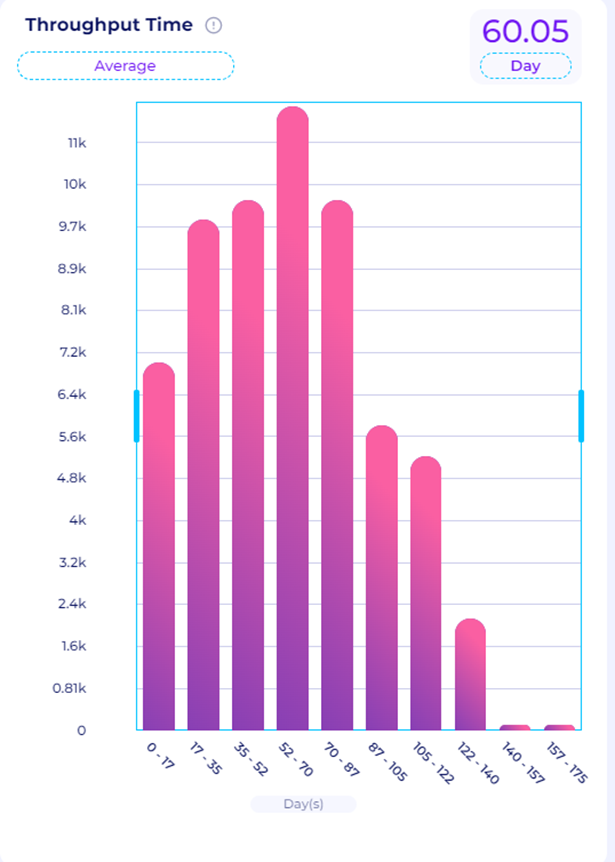
Figure 40. Throughput Time for every case
The graph in Figure 34 shows the distribution of the case duration in the dataset. Check other statistics by clicking on the “Average” button at the top right.
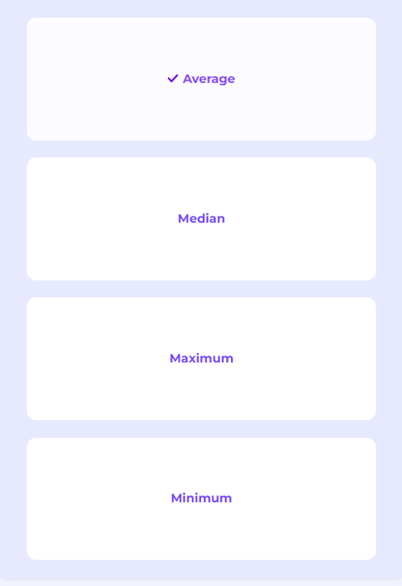
Figure 41. Temporal Statistics Options
You can also check the case duration’s average, median, maximum, and minimum throughput time. Perceptif shows the following temporal statistics:
Average: 60.5 days
Median: 58.07 days
Maximum: 174.91 days
Minimum: 0 days.
This gives us a helicopter view of the datasets’ performance. It’s clear that on average, the entire purchasing process takes up to 2 months. Ideally, businesses want to cut the case duration to improve efficiency. We can also see the throughput time between each activity in each variant. To do that, we can click the “eye“ button in the top left of the Process Explorer window.
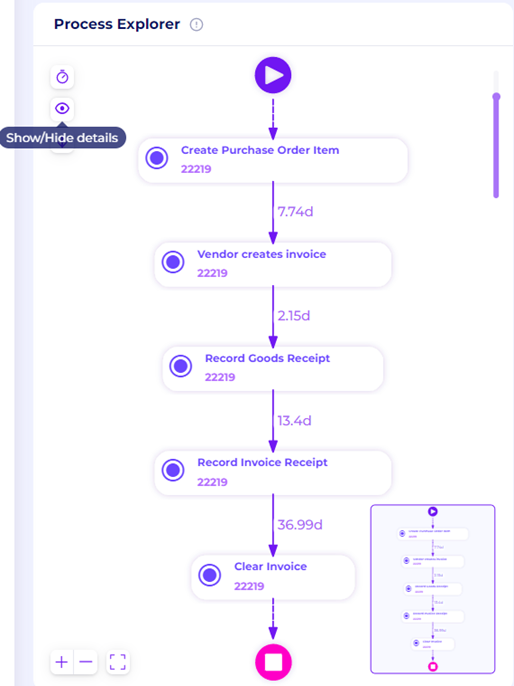
Figure 42. Throughput Time Details of Each Activity
It displays the waiting time between each activity, as Figure 36 illustrates. From “Record Invoice Receipt“ to “Clear Invoice“, it takes an average of almost 37 days of waiting time. This is an example of a bottleneck. A bottleneck delays the process and/or its performance, increasing cycle time and potentially leading to a complete standstill. Throughput Time will be referred to again in the next question.
We can also observe the median by clicking the “clock” icon in the top left.
View the average and median value of Throughput Time, as well as the case frequency between each activity node.
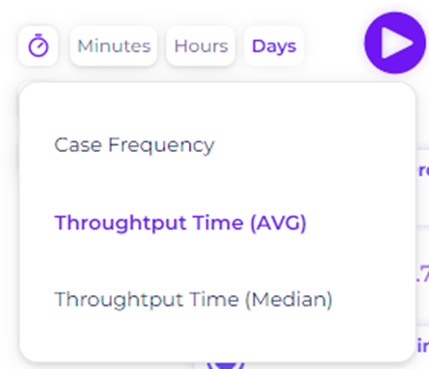
Figure 43. Throughput Time Options
Non-Ideal Variants (Q3)
The third main question is concerning deviations in the purchasing cases. Deviations could either be:
Cases where the activity flow does not match the defined process flow
Cases where the time required to complete exceeds the ideal time
Let’s first check the first type of deviation. From the previous section, we now see the ideal flow of each purchasing category. Let’s see how each category conforms to this ideal flow.
Category 1: 3-way matching, invoice after goods receipt
From the Process Discovery analysis, this is the charted process flow.
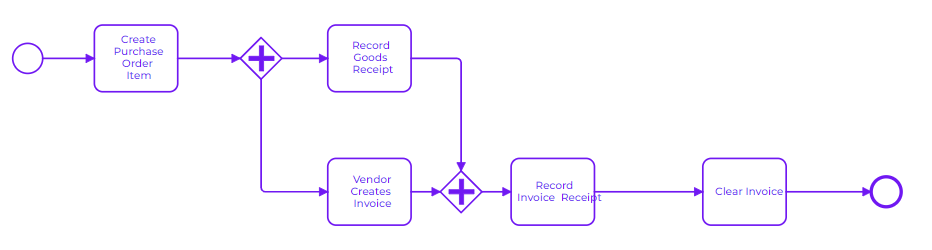
Figure 44. Process Model for the Category “3-way matching, invoice after goods receipt“
To check whether or not cases conform to this model, use the “Attribute selection” filter again to only retain cases in this specific category. Then, check the Variant Analyzer to see how the cases play out.
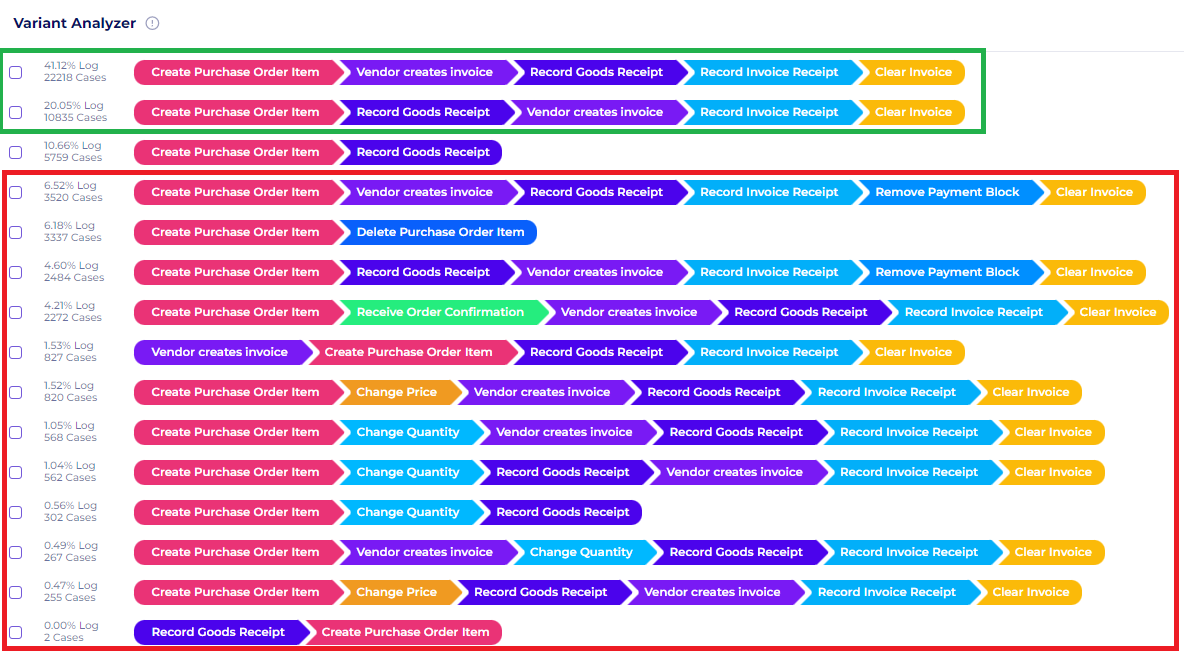
Figure 45. Variants of Category 1
Figure 45. shows all 15 variants of this category. Here are the few insights we gain:
Variants #0 and #1 (green box) are the only ones that conform with the model. Details in Process Explorer show 1587 cases - 74% of the category’s total cases.
Variant #2 are ongoing case since there are only “Create Purchase Order” and “Record Goods Receipt” activities. Dismiss this, as we can’t evaluate ongoing cases.
Variants in the red box do not conform with the process model.
Variants #3 and #5 have the additional activity “Remove Payment Block”. This activity shouldn’t exist in this category, since invoices are only received after goods are received. Thus, there is no need to block payments. To see how this impacts the process, go back to Process Explorer.
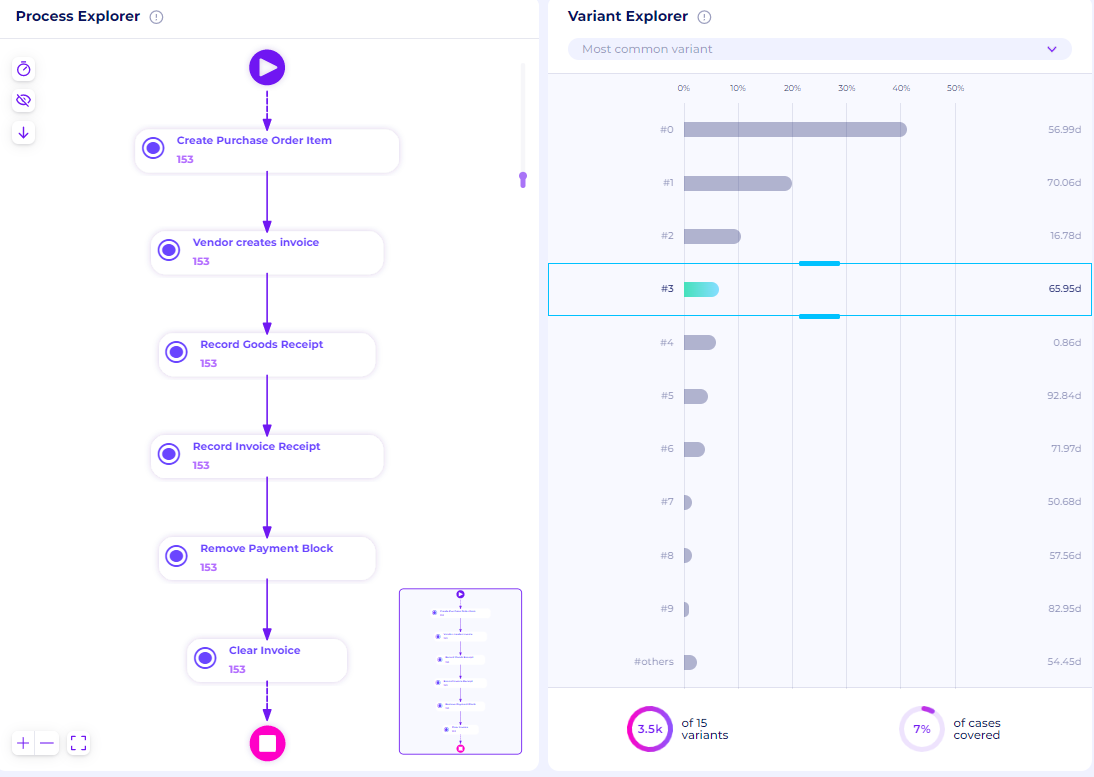
Figure 46. Variants with “Remove payment block” activity
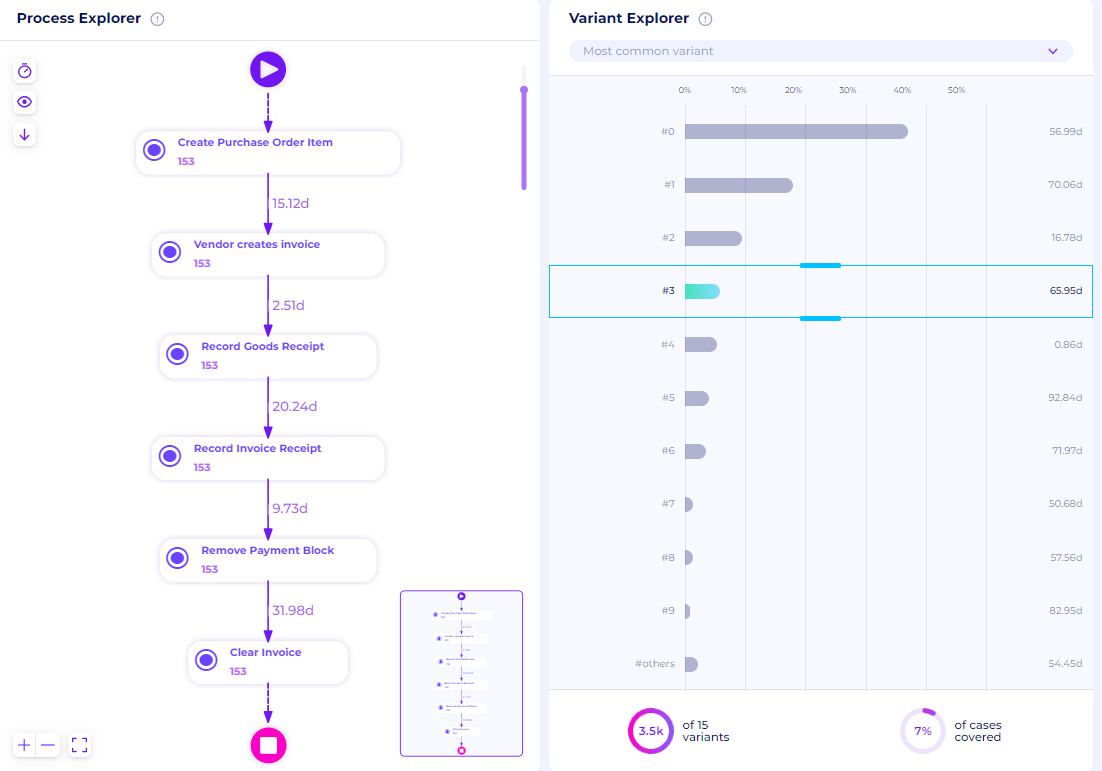
Figure 46. Variants with “Remove payment block” activity
On average, the processing time between “Record Invoice Receipt“ and “Remove payment block” takes up to 9.73 days even though this activity shouldn’t exist. Late payments can affect relationships between vendors.
Variant #4 ends with “Delete Purchase Order Item”. This shows PO cases being canceled, a form of waste within the business process that should be minimized. Check variant details in Process Explorer. This shows an average of 8 days for the PO to be canceled. If this can be reduced, the business process will increase its efficiency.
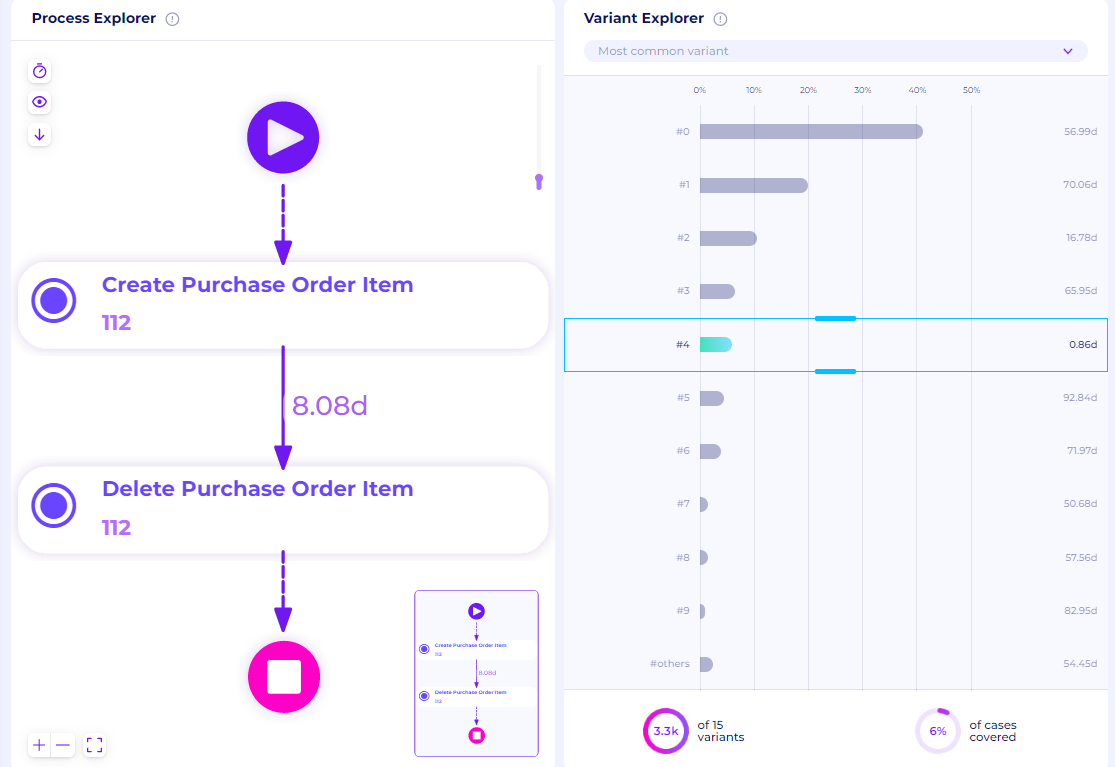
Figure 47. Variant with canceled cases
Another deviation is Variant #7 where “Vendor creates invoice” activity comes before “Create Purchase Order Item”. This shouldn’t exist, since every purchase should start with a PO. This could indicate fraud, where the purchasing shouldn’t happen but the system records incoming invoices. What’s also interesting is that it takes on average 10 days before the PO is created. This is an odd deviation and should be investigated further to optimize this business process.
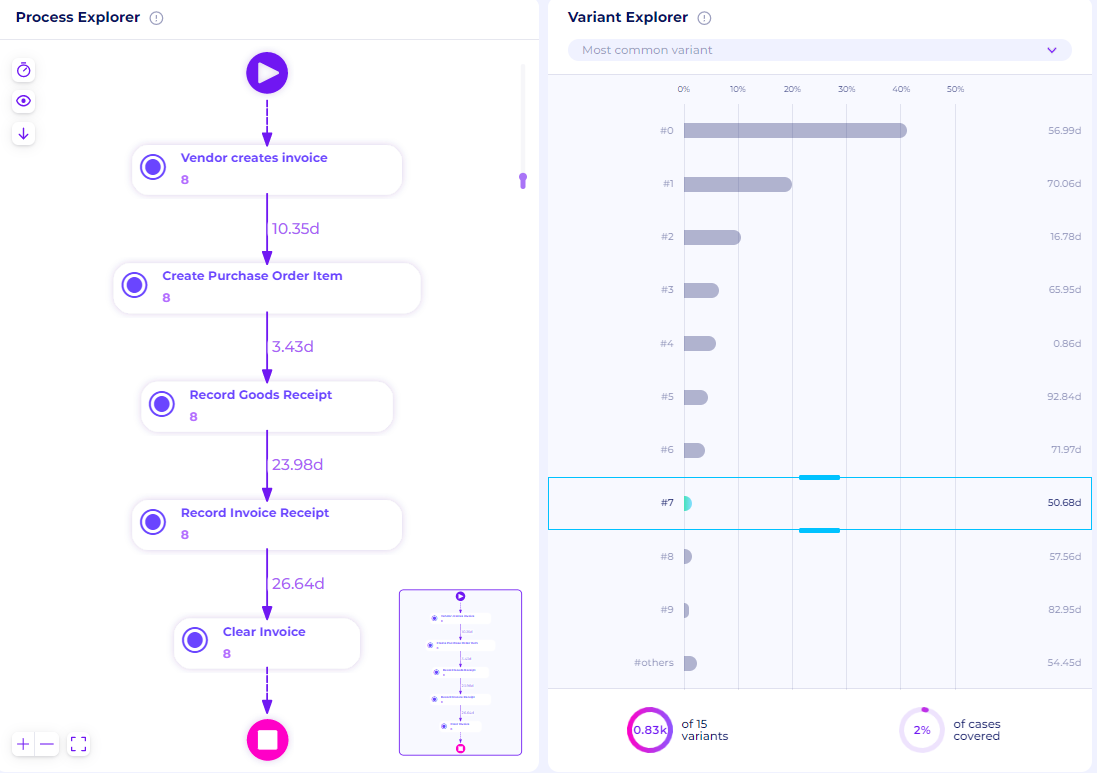
Figure 48. Variant with incorrect order
Lastly, a few variants had cases with “Change Quantity” and “Change Price”. This means there’s a change in PO, leading to an extended case duration. We must minimize this behavior. View all cases with “Change Price” activity in this category by applying another filter, “Activity selection”.
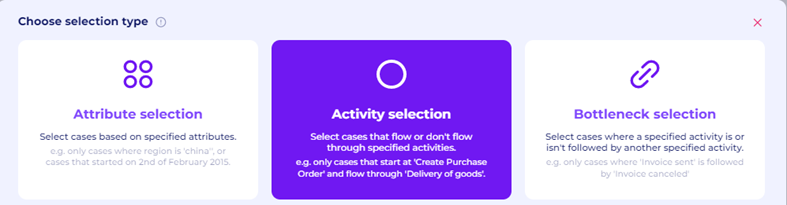
Figure 49. Activity Selection filter
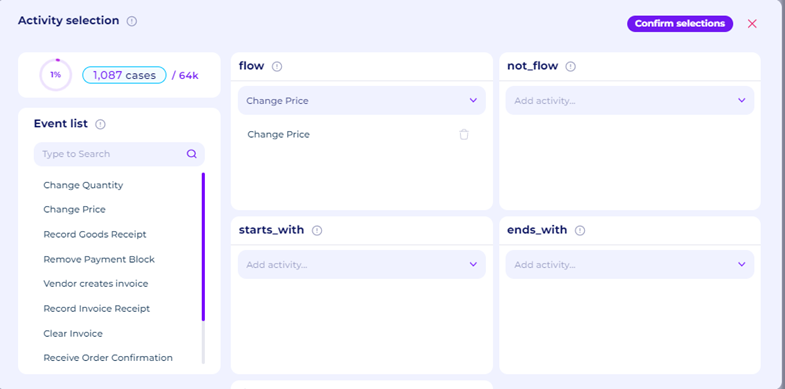
Figure 50. Flow options in the Activity Selection filter
To analyze cases that include a specific activity, use the “flow” option here. It retains cases with the selected activity and displays the following process.
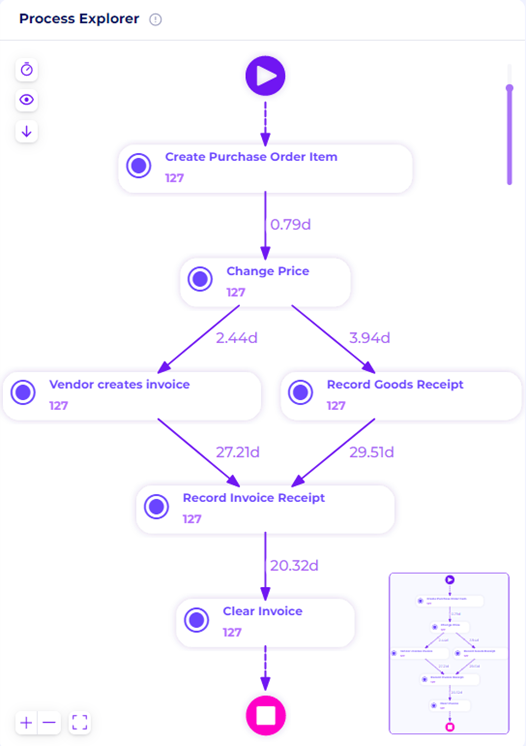
Figure 51. Cases with “Change Price” activity
Based on the Figure above, the “Change Price” activity extends the process duration by around 0.79 days. This can be minimized by strengthening the organization’s SCM (supply chain management) and SRM (supplier relationship management) to increase information accuracy.
Category 2:3-way matching, invoice before goods receipt
From the Process Discovery analysis, this is the charted process flow.
Figure 39. BPMN model of 3-way matching, invoice before goods receipt
To check whether or not cases conform to this model, use the “Attribute selection” filter again to only retain cases in this specific category. Then, check the Variant Analyzer to see how the cases play out.
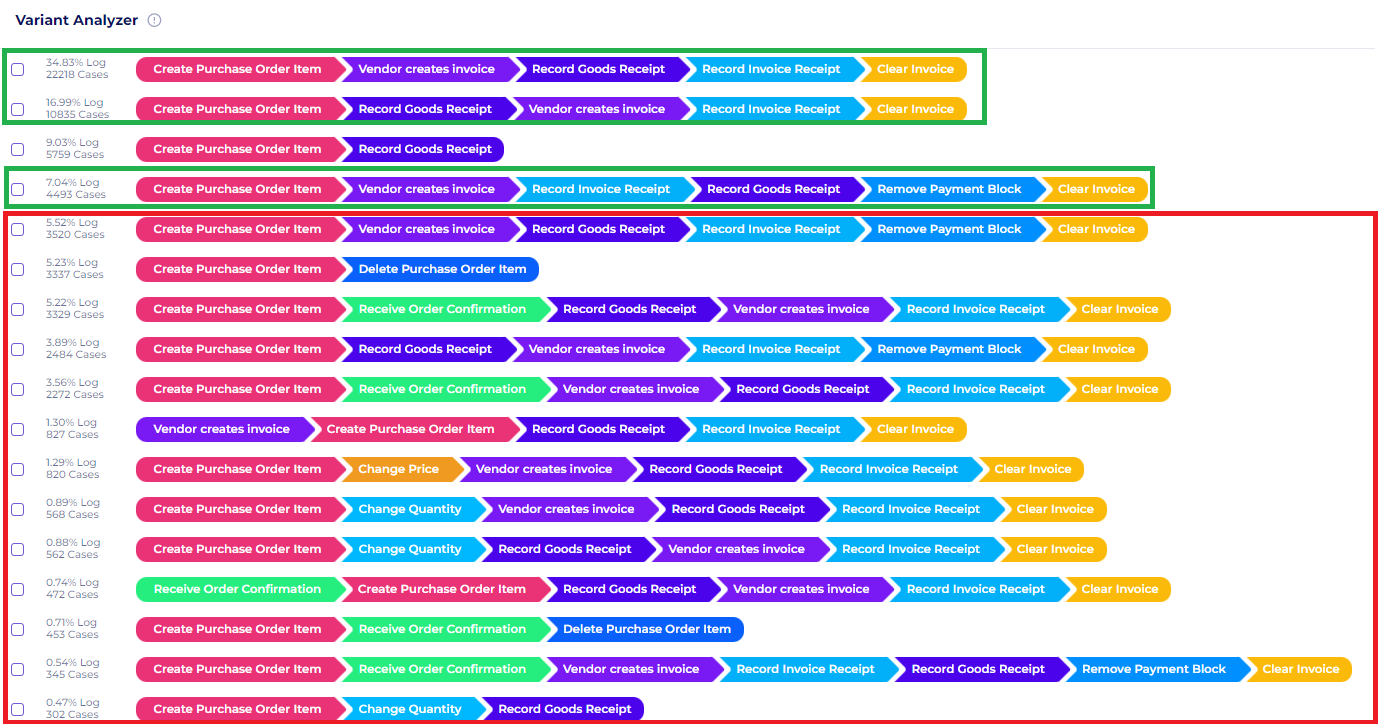
Figure 53. Variants of Category 2
The figure above. shows all variants of this category. Here are the few insights we gain:
Variants #0, #1, and #3 (green box) are the only ones that conform with the model. Details in Process Explorer show Variants #0 and #1 have 31,470 cases in total while Variant #3 has 4,494 cases.
Variant #2 are ongoing case since there are only “Create Purchase Order” and “Record Goods Receipt” activities. Dismiss this, as we can’t evaluate ongoing cases.
Variants in the red box do not conform with the process model.
Variants #4 and #7 have the additional activity “Remove Payment Block”. This activity only exists if invoices are recorded before goods are received. In Variant #4, ”Records Good Receipt” comes before “Record Invoice Receipt” just like Variant #0. Thus, there is no need to block payments. Similarly in Variant #7, ”Records Good Receipt” is done even before the invoice is sent by the vendor. There’s also no need to block payments. See how this affects case durations in Process Explorer.
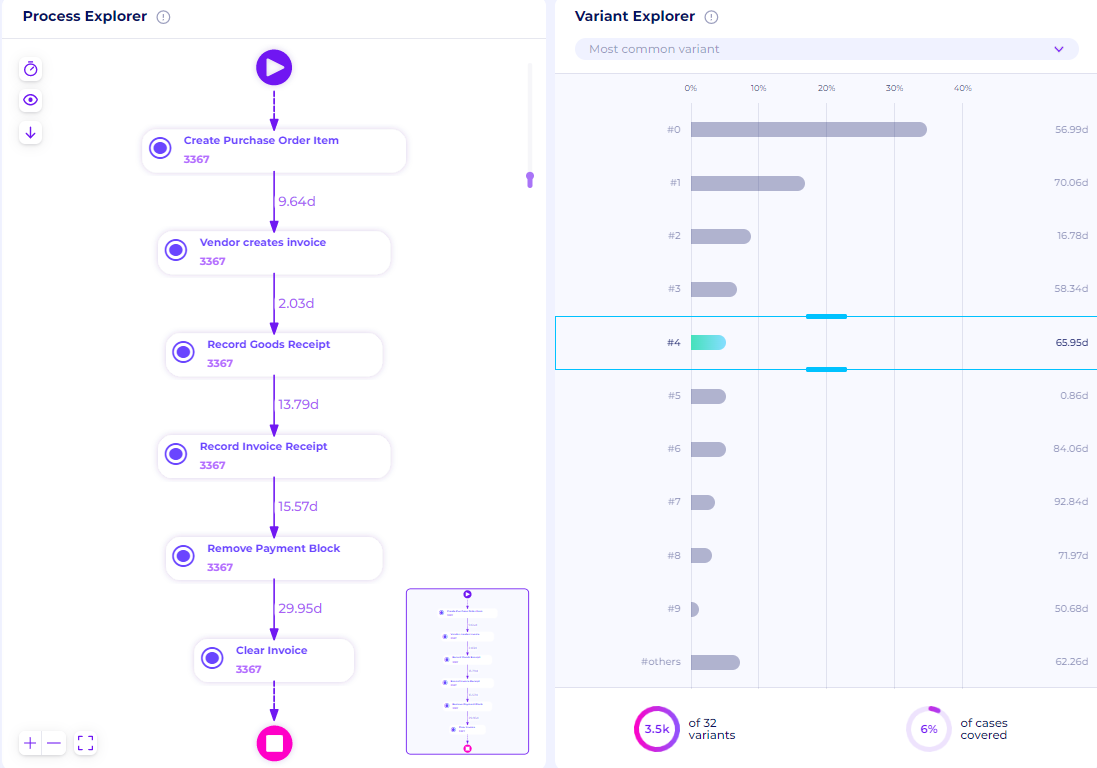
Figure 54. Variant #4 with “Remove payment block” activity
On average, the processing time between “Record Invoice Receipt“ and “Remove payment block” takes up to 15.57 days even though this activity shouldn’t exist.
In several variants like Variant #6, there’s the additional activity “Receive Order Confirmation”. Let’s assume this is a non-value-added activity since most variants don’t have this. This also extends the overall case duration time. Every PO should be automatically confirmed since it’s all system based.
Similar to Category 1, several variants end with “Delete Purchase Order Item”. This shows PO cases being canceled, a form of waste within the business process. Check variant details in Process Explorer. There are 3,070 cases here that ended up canceled within an average of days for the PO. Organizations must take action to reduce this to create a more efficient business process.

Figure 55.Variant with canceled cases
Another deviation is the incorrect order of activities, like Variant #9 where “Vendor creates invoice” comes before “Create Purchase Order Item”. This could indicate fraud, where the purchasing shouldn’t happen but the system records incoming invoices. Again, it’s interesting to note that it takes on average 13.54 days before the PO is created. This deviation should be investigated further to prevent further delays.
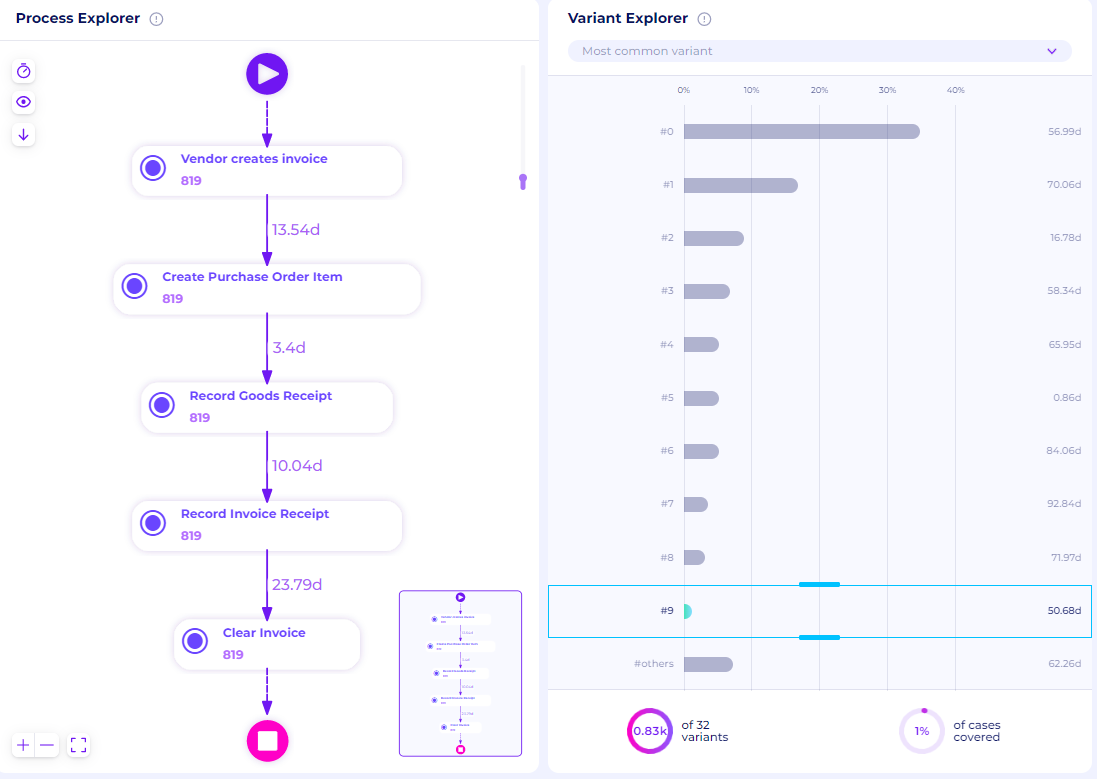
Figure 56. Variant with incorrect order
Lastly, a few variants had cases with “Change Quantity” and “Change Price”. This means there’s a change in PO, leading to an extended case duration. We must minimize this behavior. Just like before, view all cases that include this activity by applying the “Activity selection” filter.
Figure 57. Flow options in the Activity Selection filter
To analyze cases that include a specific activity, use the “flow” option here. It retains cases with the selected activity and displays the following process.
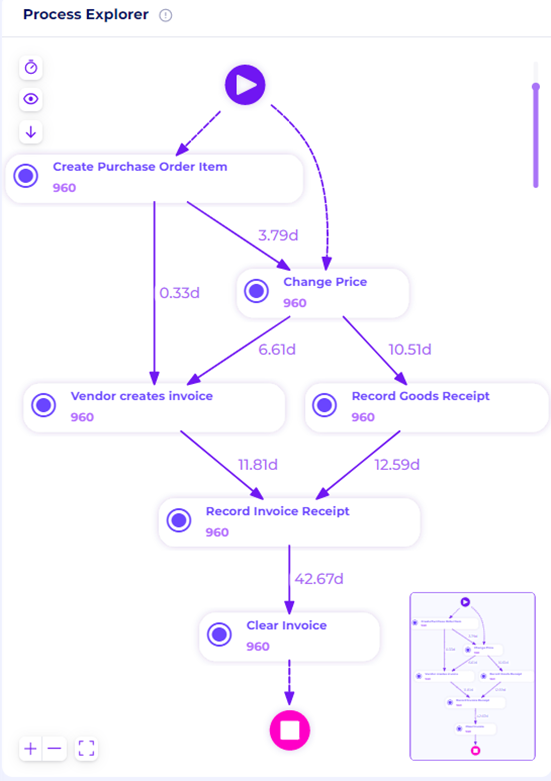
Figure 58. Cases with “Change Price” activity
Based on Figure 58, the “Change Price” activity extends our process duration by around 3.8 days. Minimize this by strengthening the SCM (supply chain management) and SRM (supplier relationship management) to increase information accuracy.
Category 3: Consignment
From the Process Discovery analysis, this is the charted process flow.
Figure 59. BPMN model of Consignment
To check whether or not cases conform to this model, use the “Attribute selection” filter again to only retain cases in this specific category. Then, check the Variant Analyzer to see how the cases play out.
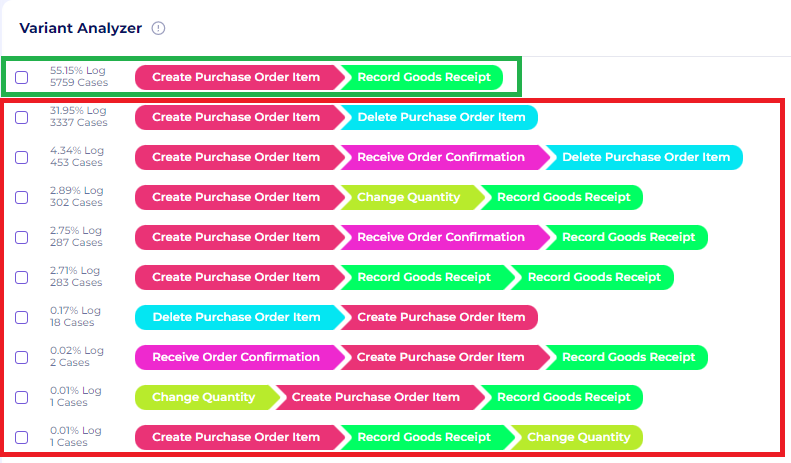
Figure 60. Variants of Category 3
Variant #0 (green box) is the only variant that conforms with the model. We can see the details in Process Explorer.
Variants in the red box do not conform with the process model.
Similar to the previous category, several variants like Variants #1 and #2 end with “Delete Purchase Order Item”. This shows PO cases being canceled, another form of waste within the business process. View details in Process Explorer.
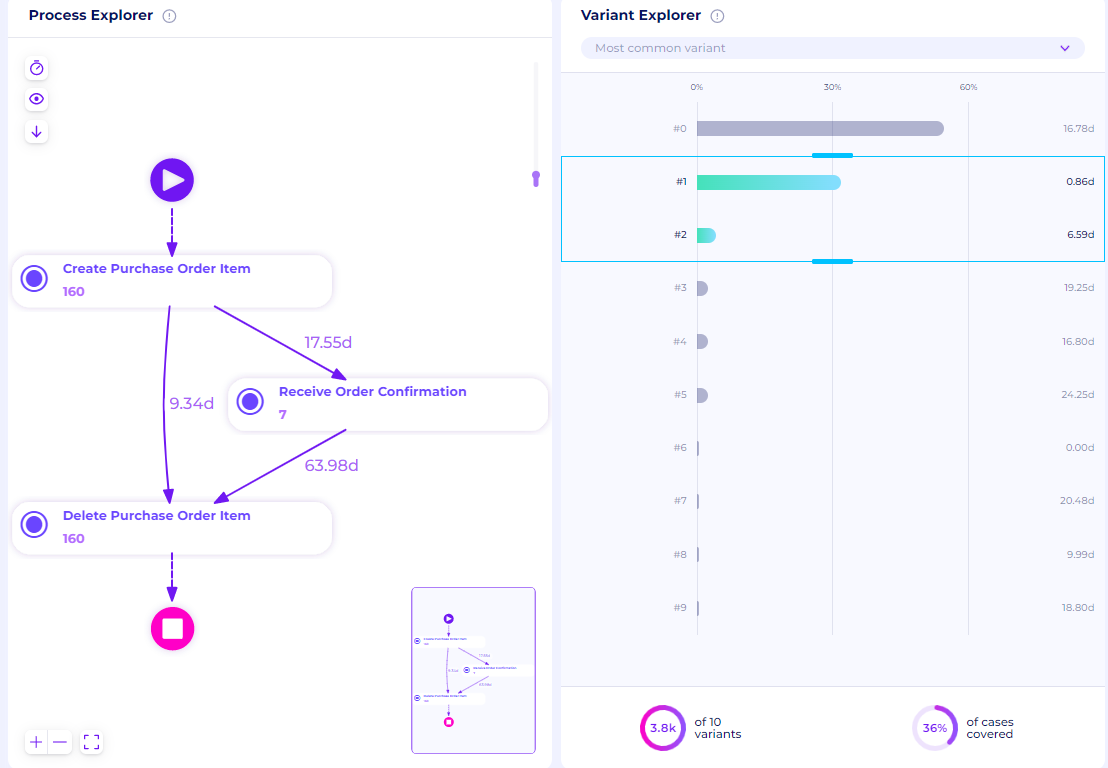
Figure 61. Variants #1 and #2 with canceled cases
This shows 160 cases ends up being canceled. This massively extends its case duration time, especially for those with “Receive Order Confirmation” activity. It takes more than 2 months for cases to be canceled, a major bottleneck that should be resolved.
There are also a few variants that include “Change Quantity”, like in Variant #3. This means there’s a change in PO, extending the case duration. Based on the figure, the “Change Quantity” activity extends our process duration by around 12 days. Minimize this by strengthening the organization’s SCM (supply chain management) and SRM (supplier relationship management) to increase information accuracy.
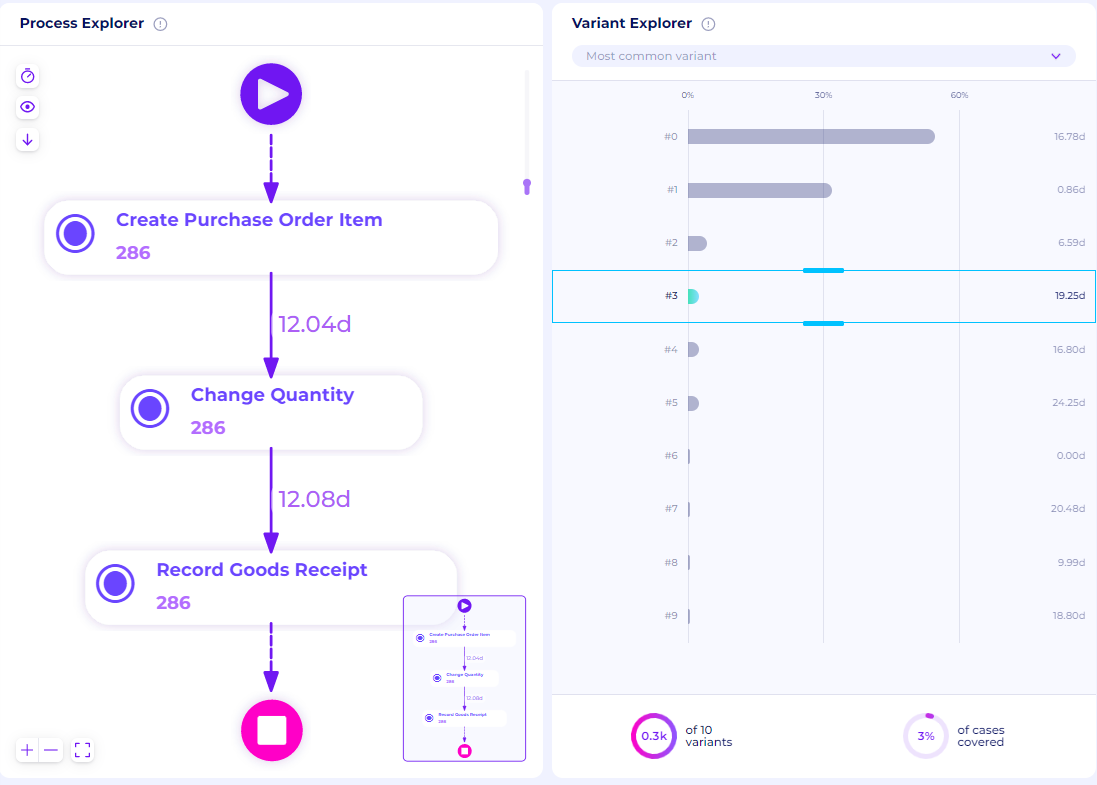
Figure 62. Variant #3 in Category 3 (change quantity)
We can also see in Variant #5 that there are cases with reworks in the “Record Goods Receipt” activity. Perceptif’s Process Explorer display details to analyze further. The reworks extend case durations up to 5 additional days. This could be improved with better scheduling from vendors and warehouses.
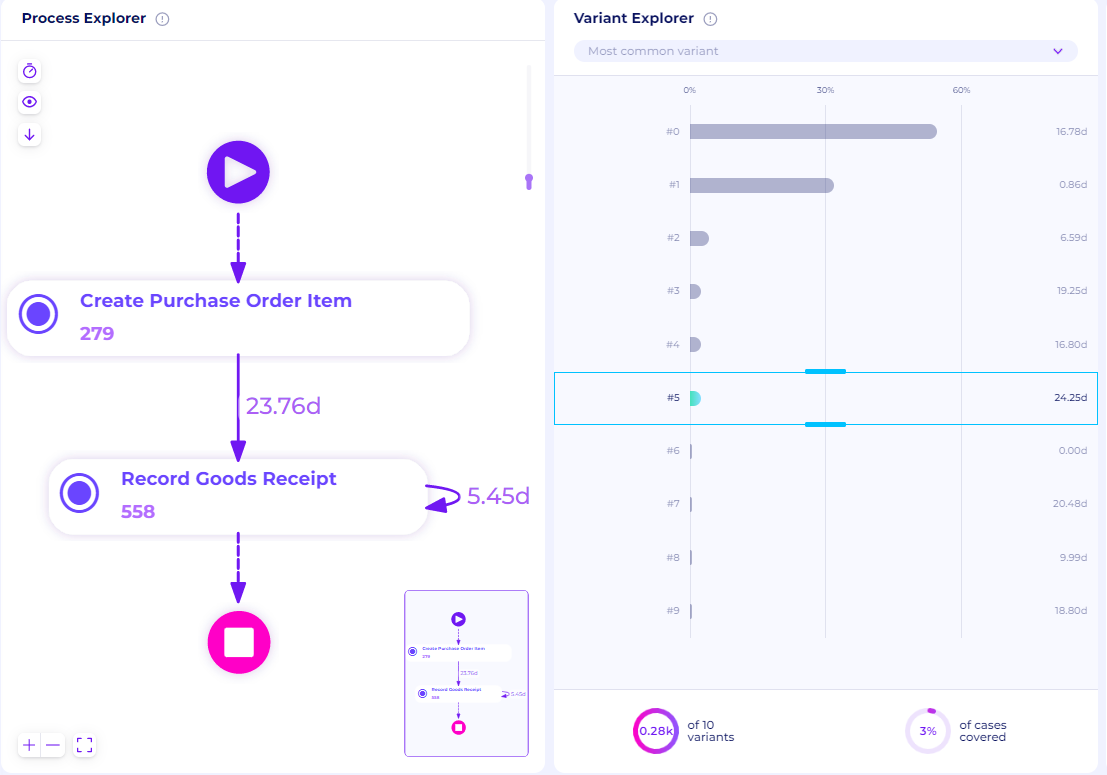
Figure 63. Variant #5 in category 3 (rework)
Deviation Based on Throughput Time
To identify deviations based on Throughput Time, utilize the window in the Discovery tab. For example, if you want to check process maps of cases with very long case durations. Use the slider in the Throughput Time window to show cases from a specific duration window.
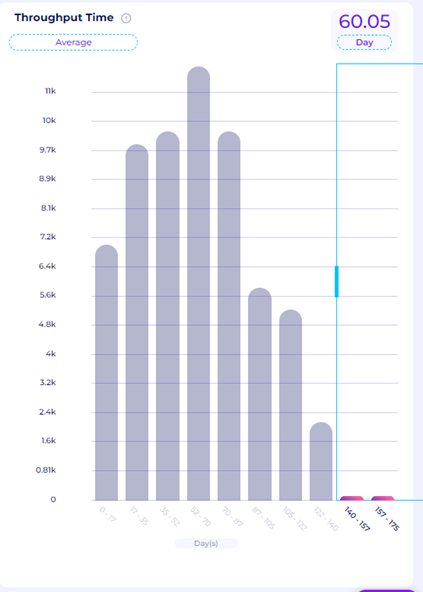
Figure 64. Throughput time filtering
In Figure 64, we want to retain cases that take 140 - 175 days to be completed. This is the outlier that needs to be investigated further. Let’s get the top 10 variants on Process Explorer.
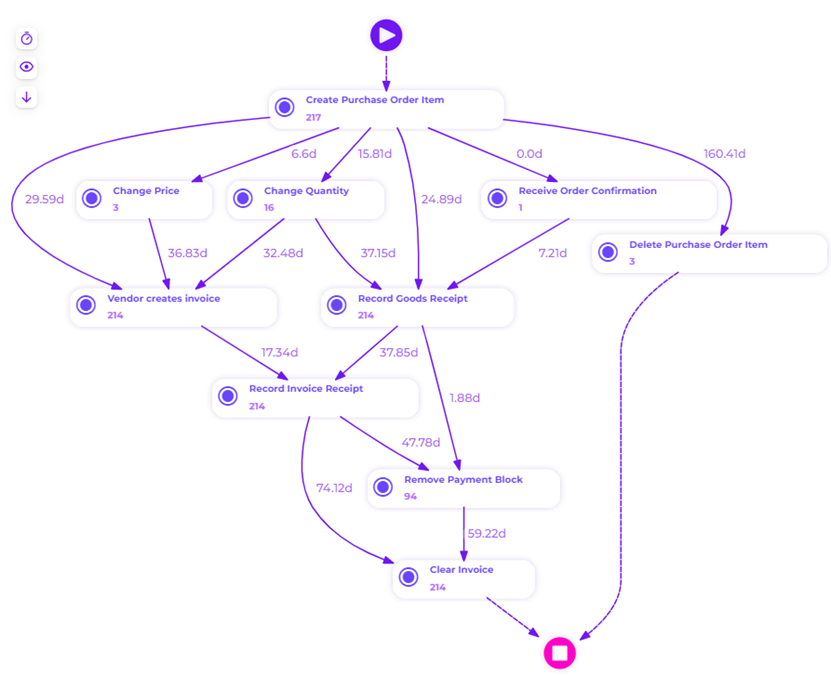
Figure 65. Process Maps of the top 10 variants with very long case duration
The process map above is the flow of cases with the longest case duration. There are multiple points between activities where long waiting time occurs. This indicates a bottleneck that needs to be evaluated.
Between “Create Purchase Order Item“ and “Delete Purchase Order Item“, the waiting time is an average of 160.41 days. This is the least desirable variant because cancellation cases are a form of wastage while long waiting time indicates bottlenecks. Another significant bottleneck is in the “Clear Invoice“ activity, where the waiting time from previous activities is a long 75.26 days and 59.22 days. This points to a need for resources involved in this activity to be evaluated.
Dashboard & Visualization
One of the most important parts of business process improvement is constant monitoring and evaluation. You want to be in control of all the processes happening in the day-to-day activities. This requires a good understanding of data with various visualizations.
Perceptif helps businesses visualize data streams and build dashboards for easy monitoring and evaluation. Here’s how building engaging dashboards and visualizations works.
Create new tab by clicking on the “+” next to Discovery tab, then “Create new page”.
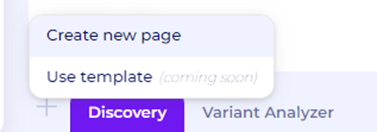
Figure 66. Create a new page
Select Whiteboard to create a new whiteboard tab.

Figure 67. New tab options
To start building dashboards, click the “Edit” button at the top right.

Figure 68. Edit Button on the whiteboard
To import visualization widgets, click the “Widgets” button at the top. A new window will appear with various options to choose from.

Figure 69. Widgets button
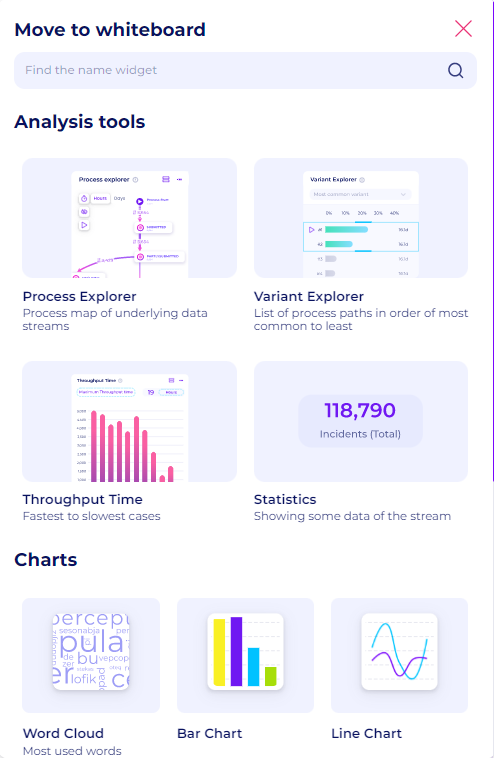
Figure 70. Data visualization widgets
Click any one of the widgets. For example, let’s create a new bar chart visualization. Drag and drop the bar chart widget to the board. A new bar chart window will then appear. To configure it, click the “Setting” button at the top of the widget.
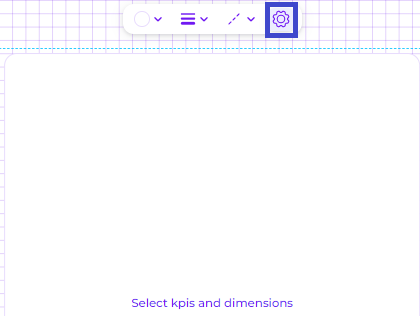
Figure 71. “Setting” button to configure the widget
Start configuring data by clicking the “data” window on the right. Add multiple KPIs and Dimensions easily with the “+” button.
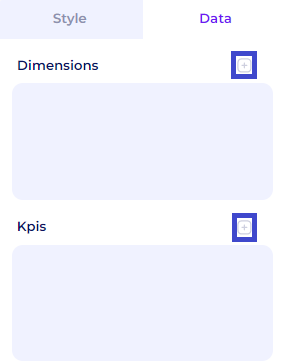
Figure 72. Add KPIs and Dimensions
Then, start adding dimensions and KPIs for the visualization. For example, select “Timestampt” as dimensions, “case_id” and “activity” as our KPI. Perceptif also allows various other functions for KPIs (Sum, Average, Max, Min, Count, and Count Distinct).
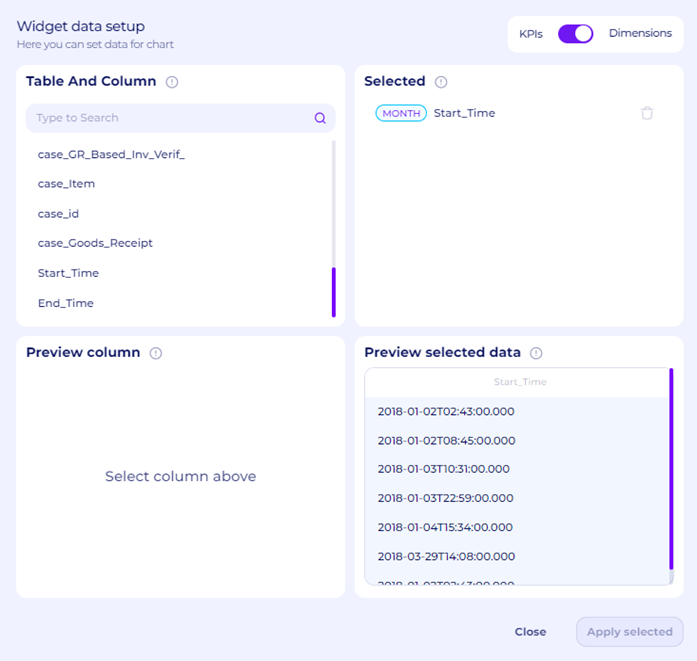
Figure 73. Select dimensions for visualization
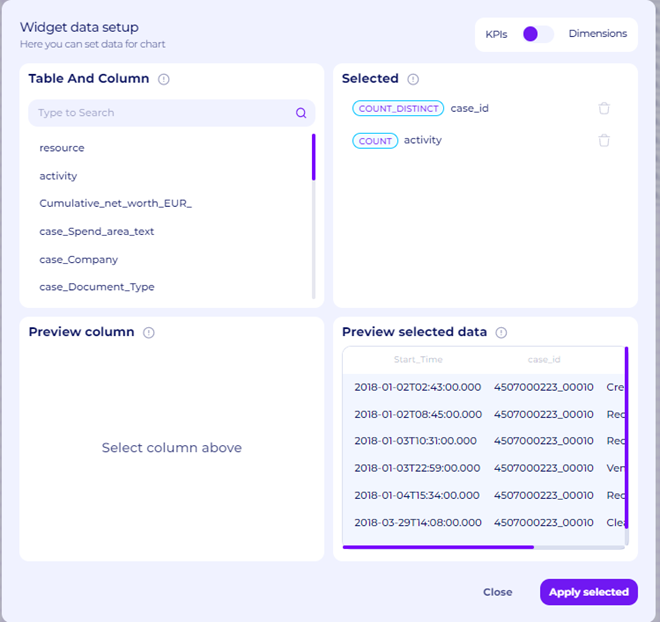
Figure 74. Select KPIs for visualization
After clicking “Apply Selected”, the visualization will be shown on the whiteboard. You may also sort values with the “Sorting” option below Dimension and KPI.
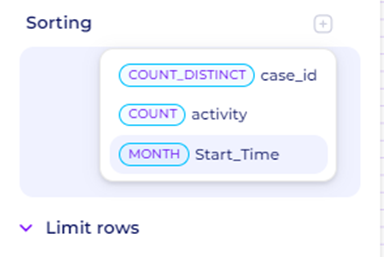
Figure 75. Sort the Visualization
Adjust the title, styles, font size, and legend in the style window as you like.
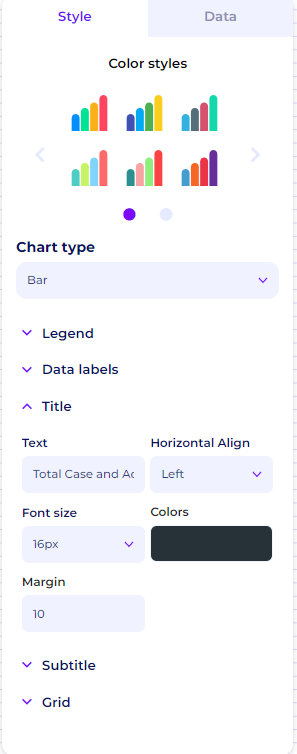
Figure 76. Style Window
Now, you can start to create engaging visualizations and build complete dashboards to kickstart your business process improvements.
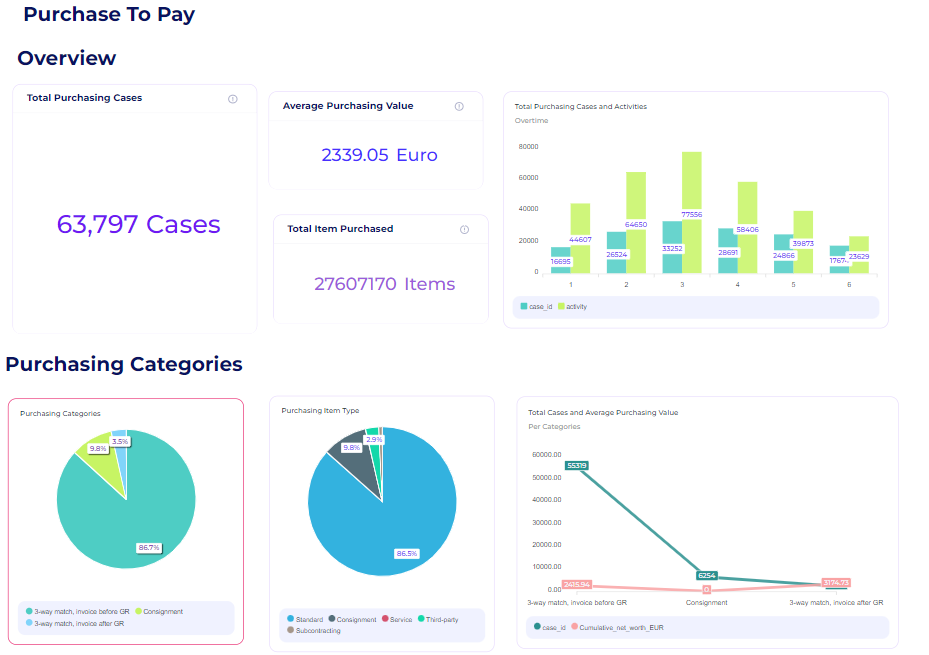

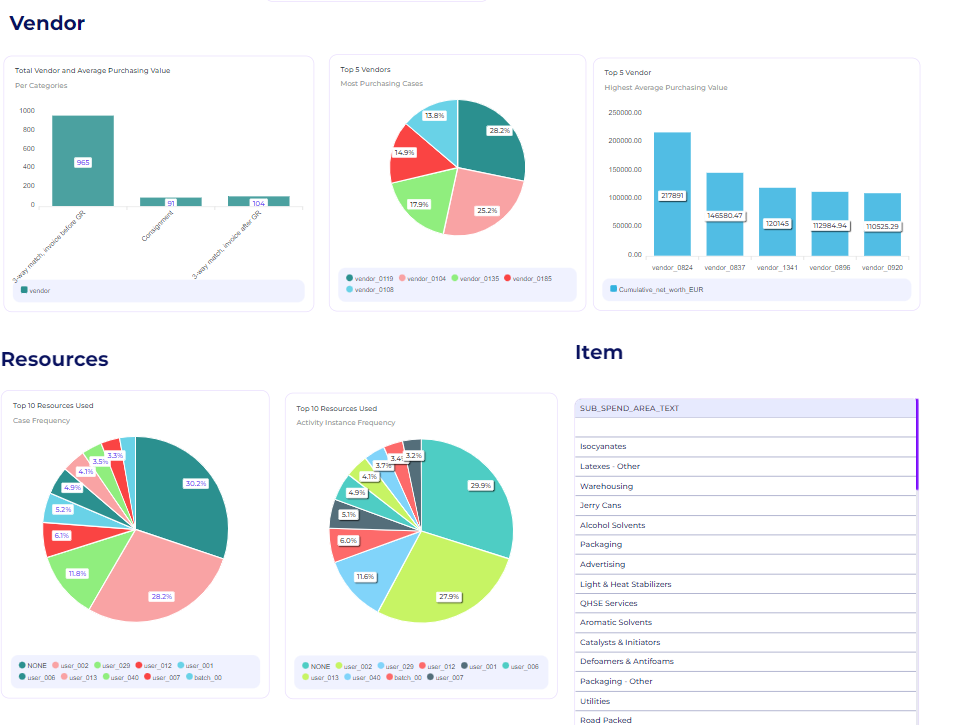
Figure 78. Dashboard Example