
Loan Application Demo
Introduction
The loan application process is a critical aspect of the financial institution’s business process. It is important to ensure that the loan application process is efficient and effective to avoid delays and errors. The current loan application process is complex and can be improved by leveraging process mining techniques. Process mining can help identify bottlenecks, inefficiencies, and other issues in the loan application process. By analyzing the loan application dataset using process mining techniques, the financial institution can identify areas for improvement and optimize the loan application process to improve customer satisfaction and reduce costs.
These business processes are often supported by an integrated enterprise system that records each activity in an event log. Each event in the log can include several attributes such as the timestamp, who performed the activity, what activity was being performed, which cases were affected, and other data that the system can capture. We can utilize this data to perform a process mining analysis with Perceptif.
About Dataset
Dataset Format
Event data is commonly stored in tables, CSV files (Comma Separated Values), and spreadsheets (like Excel files), where each row or column represents an event. For process analysis using Perceptif, there are 3 main attributes required in your data:
Case Id: Unique identifier of each case in a process.
Events: An activity completed in a single case Id. Each can have multiple Events.
Timestamps: When activity is performed in the system. Event log data can have 2 timestamps - a start (when an event begins) and an end (when it's completed).
Other optional attributes such as case attributes and resources can also help describe the business process.
Dataset Source
The sample data is a real-life financial event log of the loan application process belonging to a bank in the Netherlands. It contains 13,087 cases and 262,200 events that are distributed over 36 activities with timestamps between October 1st, 2011, and March 14th, 2012. This dataset has been provided for the BPI Challenge in 2012 and is publicly available. Download the modified datasets that will be used in this demonstration here.
The process can be summarized as a process where a submitted loan/overdraft application is checked automatically. If the application does not pass the checks, it can be declined. Additional information is obtained by contacting the customer by phone. Offers are sent to eligible applicants and their responses are assessed. Applicants are contacted further for incomplete/missing information. The application is then subjected to a final assessment upon which the application is either approved and activated, declined, or canceled.
The dataset record all activities in three main event status, which are START, SCHEDULE, and COMPLETE. START, as its name suggests, denotes the start of a worker's task. The event status is changed to COMPLETE once the worker has completed the task. SCHEDULE is the designation for tasks that have been scheduled for a future date (or time). For ease of analysis in this demo, we'll only retain and analyze cases where the task status is COMPLETE.
Dataset Attributes
Below is a description of the data attributes for our analysis.
Attributes | Description |
case_id | Case identifiers |
activity | The name of activities done in a case_id |
timestamp | The timestamp when activity was started |
resources | The unique identifier of the person who executed the task. |
reg date | The timestamp when the application is subbmitted |
Amount Req | The amount of money requested by the applicants |
transition | The state of the activity. We only retain completed activity. |
Main Questions
The bank is looking to find how to increase its productivity regarding loans by recording its loan application process. They reckon that if loans can be processed in a more consistent manner, they can build better trust with clients.
These are the questions they are keen to explore:
How many applications that get submitted are then approved?
How does the actual process play out and is there a bottleneck where an extraordinary timeframe is given to a process?
Are there applications that get lost in the middle, applications that never get resolved (Approved, declined, or canceled)
Understanding the activities in the data
After importing the data into Perceptif, we can start understanding our data by observing all the activities detected. To do that easily, we can utilize the whiteboard and the visualization tools in Perceptif.
Create a new tab by clicking on the “+” next to the Discovery tab, then “Create new page”.

Figure 1. Create a new page
Select Whiteboard to create a new whiteboard tab.

Figure 2. New tab options
To start building dashboards, click the “Edit” button at the top right.

Figure 3. Edit Button on the whiteboard
To import visualization widgets, click the “Widgets” button at the top. A new window will appear with various options to choose from. For now, let’s pick the Simple Table. Drag and drop the Simple Table icon onto the whiteboard

Figure 4. Widgets button
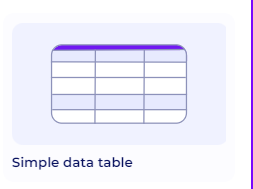
Figure 5. Simple Data Table widget
To configure it, click the “Setting” button at the top of the widget.

Figure 6. Setting icon on top of the widget
Start configuring data by clicking the “data” window on the right. Add multiple KPIs and Dimensions easily with the “+” button.
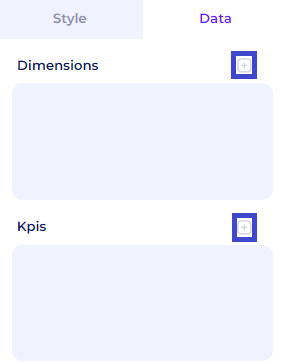
Figure 7. Add KPIs and Dimensions
For the time being, we want to look at the activities that are performed in the dataset and how frequently they occur. To do that, select the activity attribute as the dimensions, and case_id with the count function as the KPI.
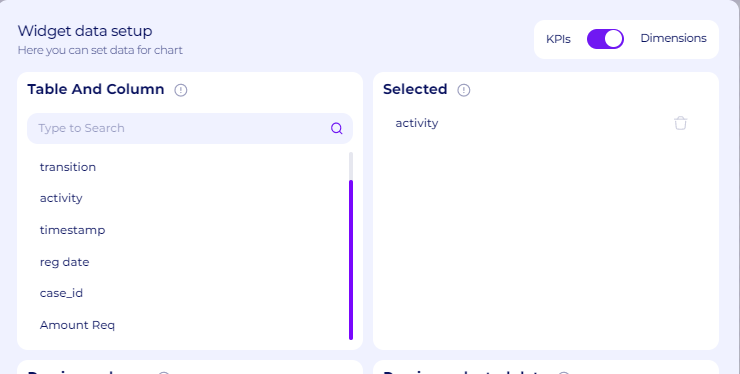
Figure 8. Activity as the dimensions
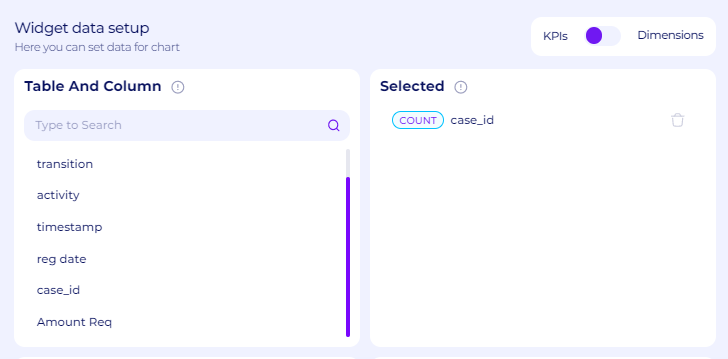
Figure 9. Count Case_id as the KPI
A new table will load, showing us the list of the activities and the frequency as follows. As we can see, the activities are composed of three different groups. The tasks that begin with the letter A are computer-automated tasks that correspond with the application. The offers that are communicated to the client match the tasks that begin with the letter O. From the dataset, it is unclear whether these tasks are produced by the application automatically or if human labor is involved. The work items that belong to the application and begin with the letter W correspond to the tasks that humans perform.
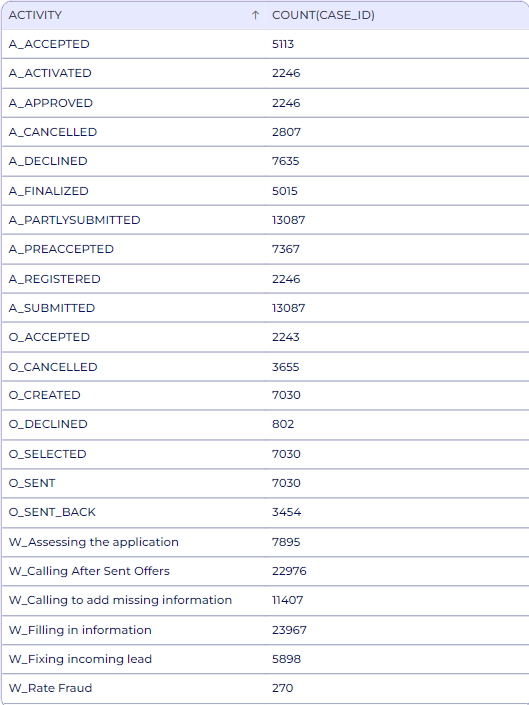
Figure 10. All activity and frequency in the data
We can also get the detail of each activity in all three groups as follows (information from this paper).
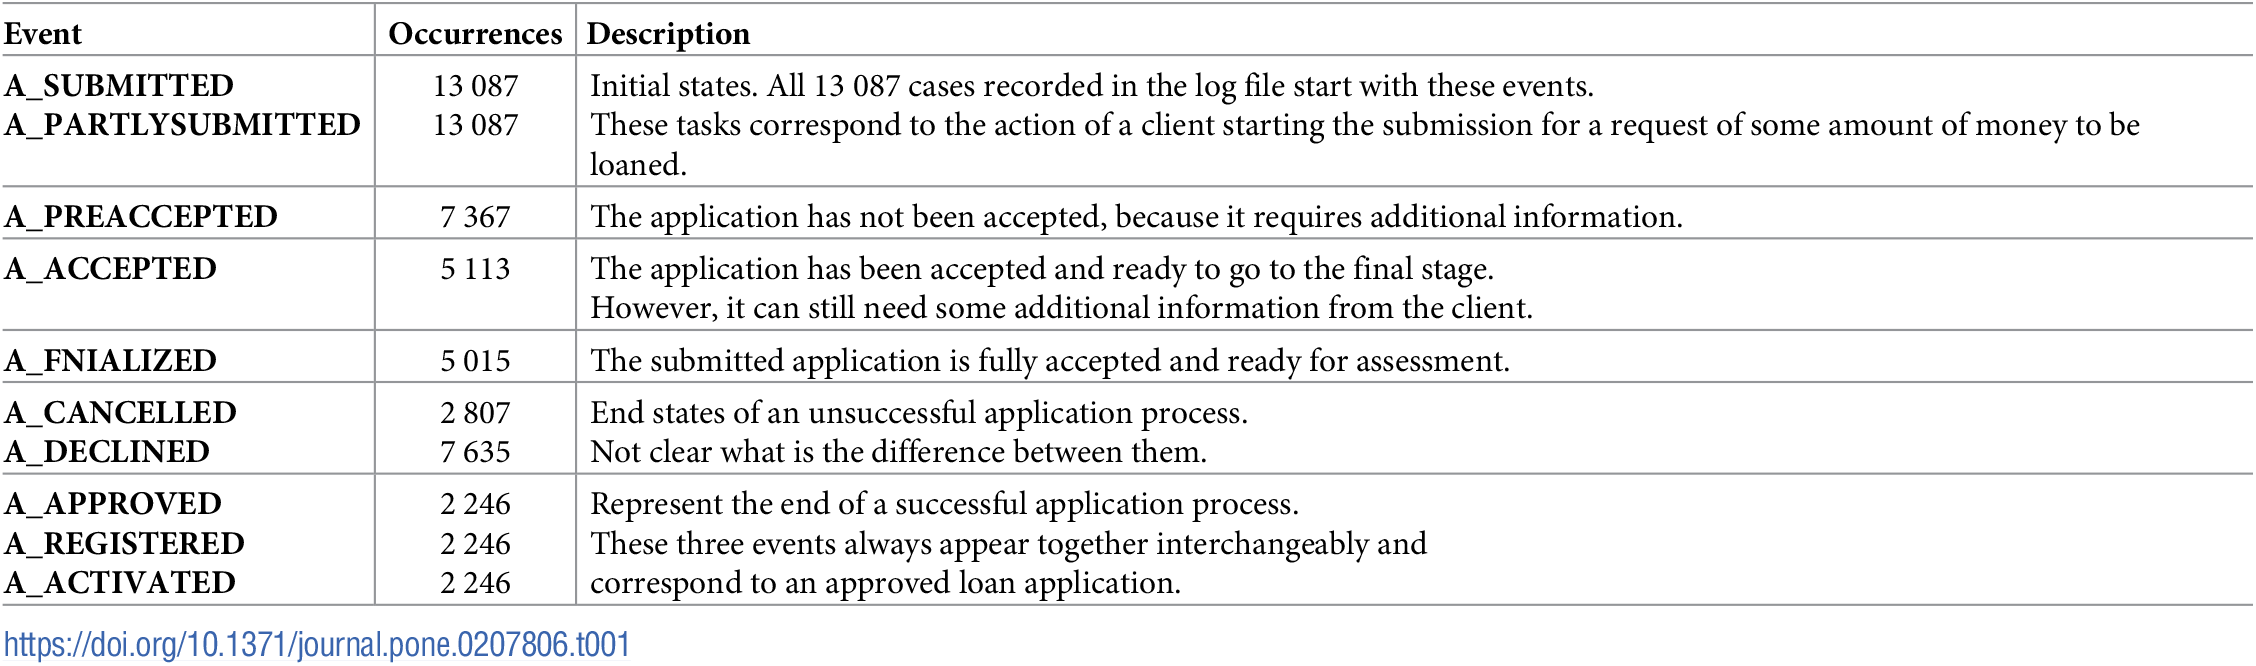
Figure 11. System application tasks that were identified during the processing of the event log
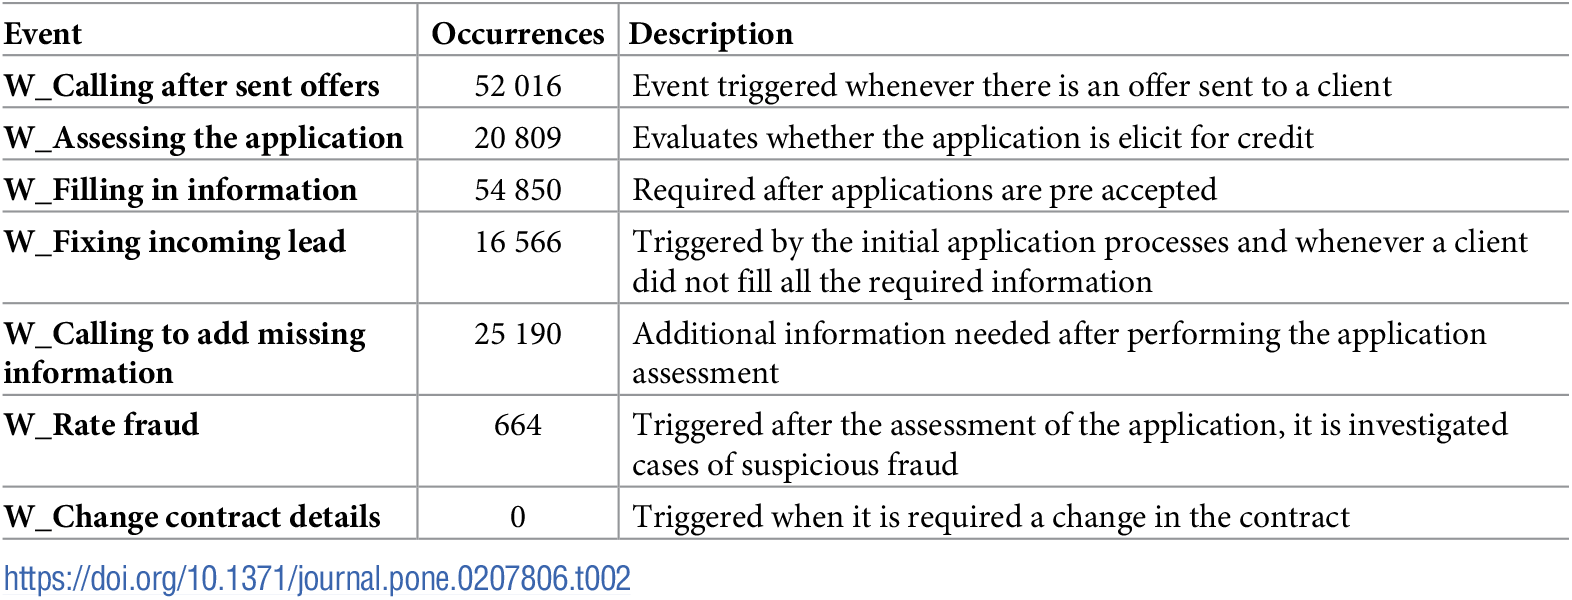
Figure 12. Worker tasks that were identified during the processing of the event log

Figure 13. Tasks corresponding to offers that were identified during the processing of the event log
From the Figures above, we can see that there are multiple redundant activities, but we can confirm this later.
Answers to Main Questions
How many applications that get submitted are then approved, declined, and canceled?
As mentioned previously, loan cases that are accepted are marked with activity A_Approved, cases that are declined are marked with A_Declined, and cases that are canceled are marked with A_Cancelled. To retain cases with a specific activity, we can use the Activity Selection filter in perceptif as follows.

Figure 14. Activity Selection Filter
To see how many cases that are ended accepted, we can select the Case flow through option and select the A_Approved activity. It will retain cases that that has A_Approved activity in them. As we can see below, 17% of all the cases (2,246 cases) ended up approved. These types of cases also automatically got the offer. This might be a sign of inefficiency since the bank will only get revenue from the interest of an accepted loan
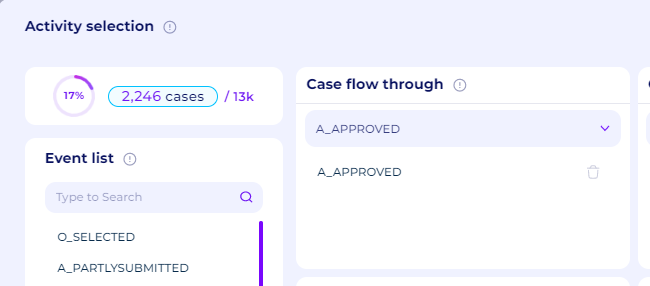
Figure 15. 17% of all cases (2,246 cases) are ended up approved
To see how many cases that are declined and canceled, we can do the same as previously and retain cases that flow through A_Declined and A_Cancelled. We can see that 58% of all cases are declined and 21% of all cases are canceled.
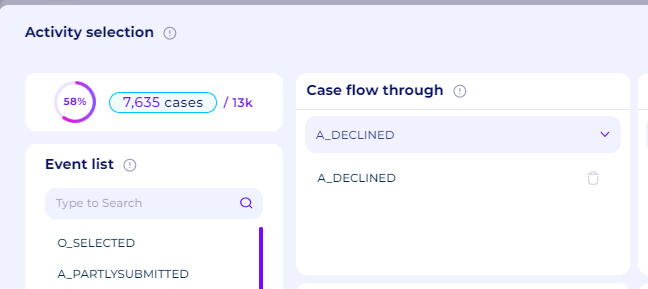
Figure 16. 58% of all cases (7,635 cases) ended up declined
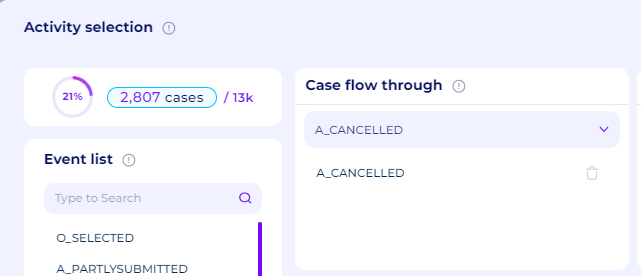
Figure 17. 21% of all cases (2,807 cases) ended up canceled
We can see this statistic easily by using the Attribute Selection filter and the Pie chart widget on the whiteboard. In the attribute selection filter, we will retain all cases that have A_Approved, A_Cancelled, and A_Declined by checking the tick box.
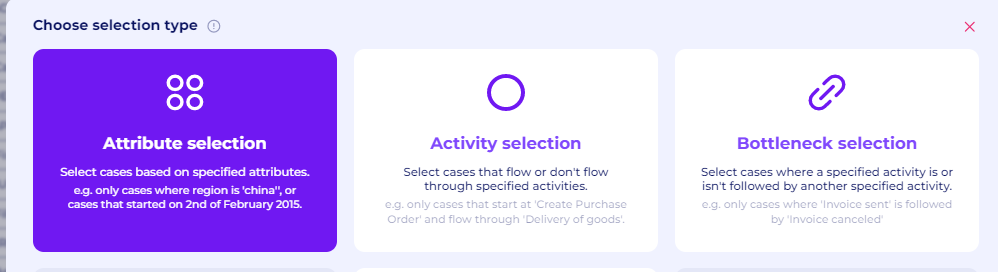
Figure 18. Attribute Selection filter
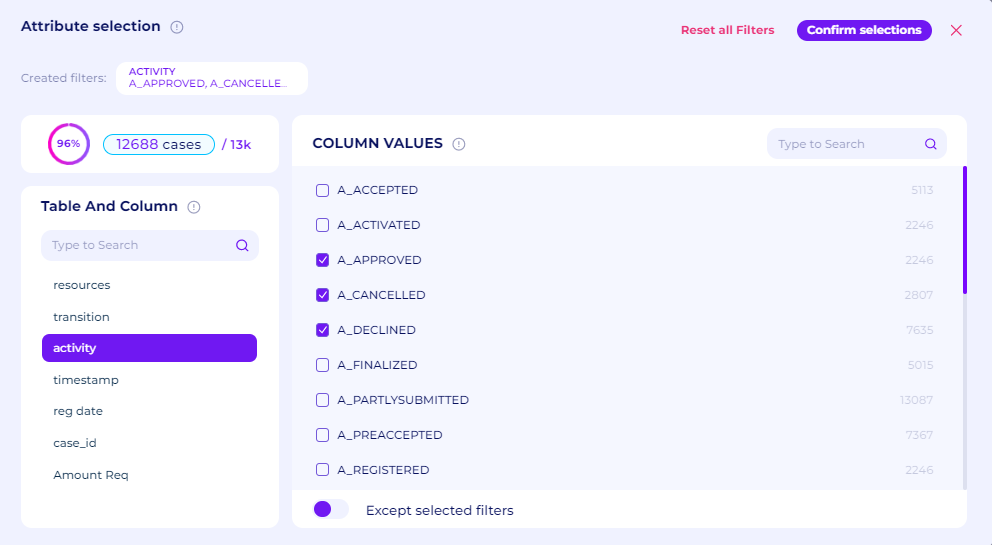
Figure 19. Retain all cases with A_Approved, A_Cancelled, and A_Declined
Back on the whiteboard, we can drag and drop the Pie chart widget, and then pick activity as the dimensions, and count case_id as the KPI. A pie chart will show the statistics and the percentage of loan application status.
Figure 20. Activity as the dimensions
Figure 21. Count Case_id as the KPI
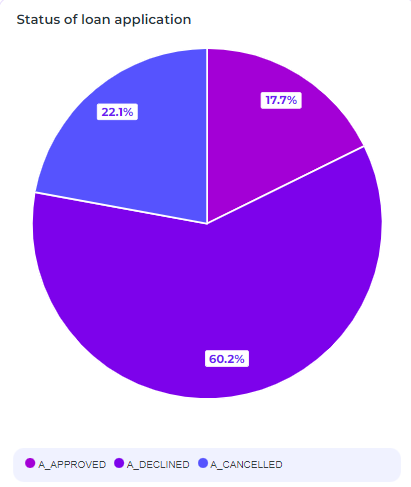
Figure 22. Loan application status
How does the actual process play out and is there a bottleneck where an extraordinary timeframe is given to a process?
The easiest way to see the actual process in the data is to check the variant analyzer. The variant analyzer will show all possible process maps of the underlying data streams, sorted from the one with the most cases.
To check the variant analyzer, go to the variant analyzer tab, which is next to the discovery tab

Figure 23. Variant Analyzer tab
The full variant analyzer tab will show all the possible process maps, sorted from the most common variant. There’s also statistical information, which is the number of cases in each variant and the percentage next to the process map
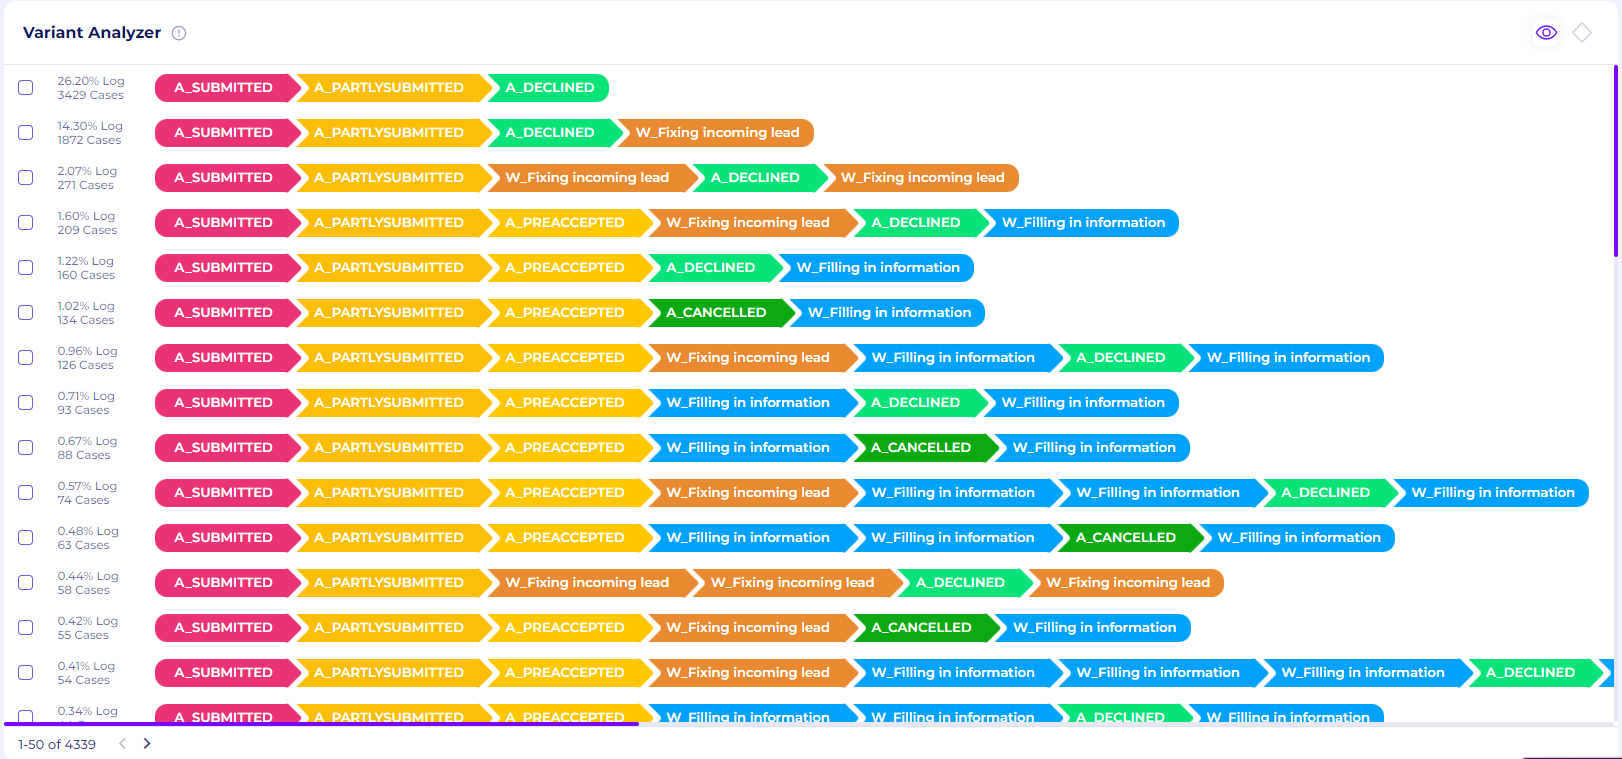
Figure 24. Variant analyzer page
If the checkbox next to the process maps is ticked, it will show a case explorer page. This shows the list of cases corresponds to that specific variants
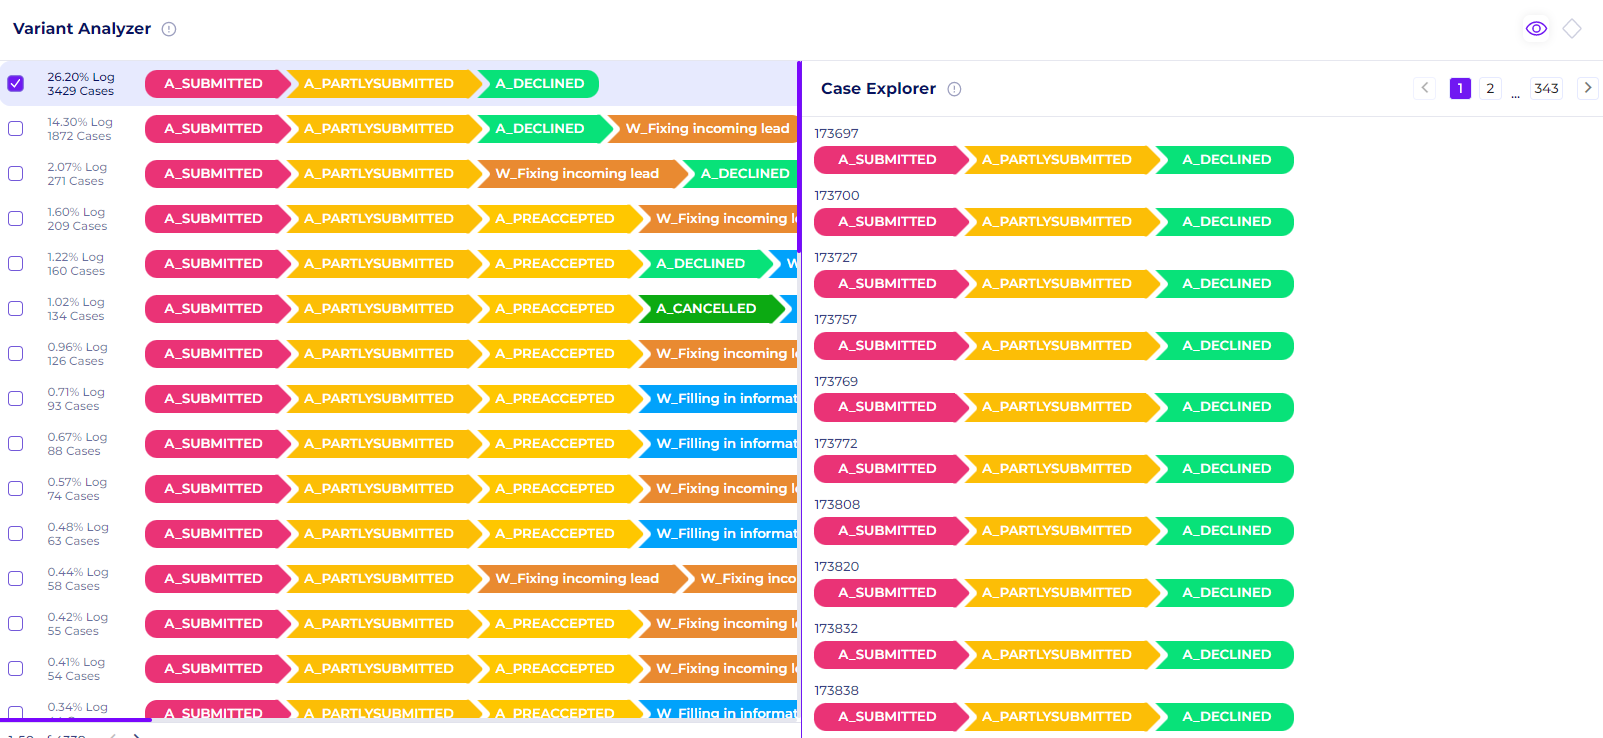
Figure 25. Case Explorer of a variant
If one of the activities of a specific case id is clicked, it will show the detail of that case and all the attributes of that case id
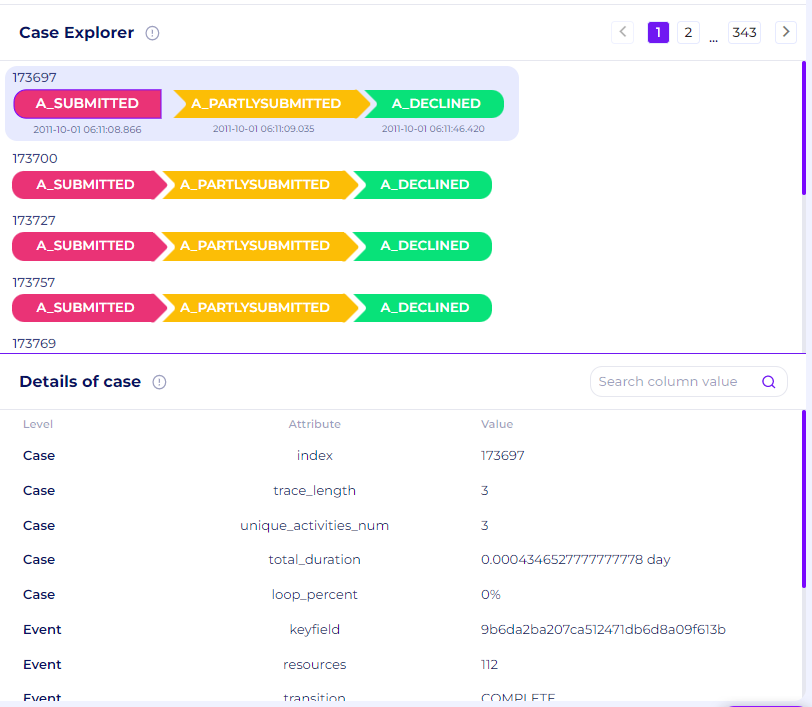
Figure 26. Detail of the case
Now to do the analysis, let’s focus on the top 10 variants shown in the variant analyzer. We can see that for all the top 10 variants (in fact, for all the variants), the activity A_SUBMITTED is always followed by A_PARTLYSUBMITTED. This demonstrates redundancy and may help drive up operational costs, which would then lead to a drop in output and efficiency.
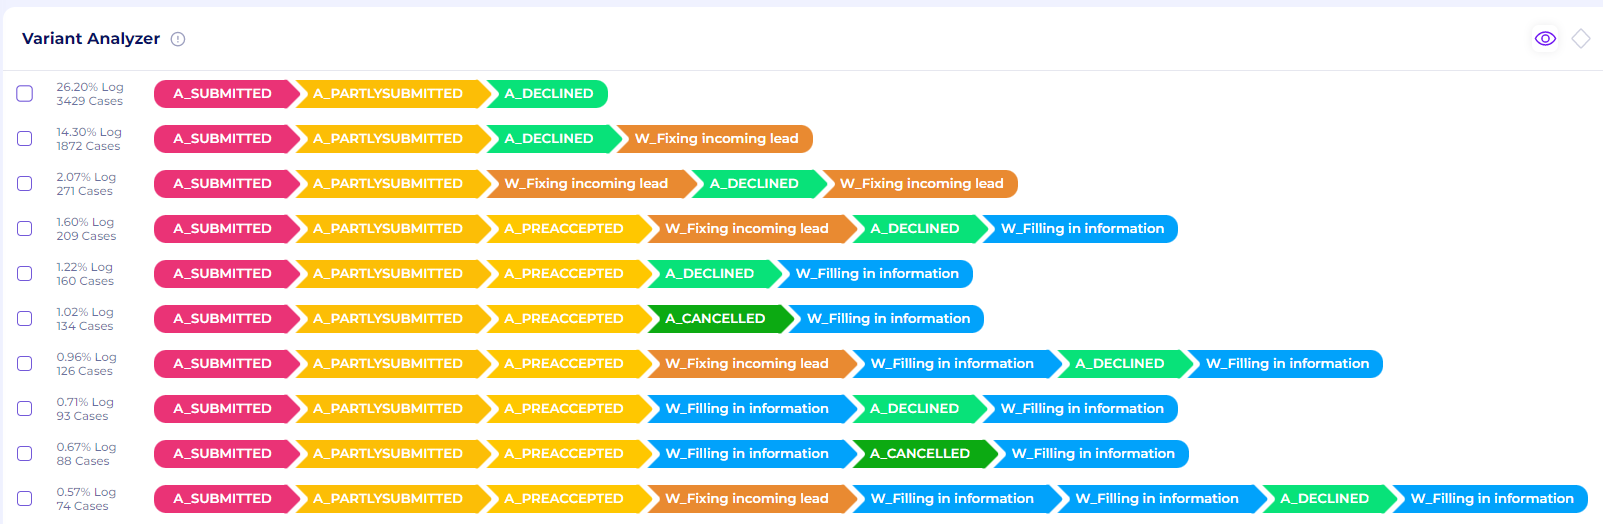
Figure 27. Top 10 variants variant analyzer
To check how the redundancy affects the process, we can go back to the discovery tab, and click all the top 10 variants. We can check the throughput time between activities by clicking the eye icon on the process explorer. We can check the throughput time in minutes by clicking the timer icon and selecting the Minutes option. We can see that between A_SUBMITTED and A_PARTLYSUBMITTED, the waiting time is around 0.01m, which is not significant. Even so, because both of these activities are redundant activities, it's best to just delete one of these activities
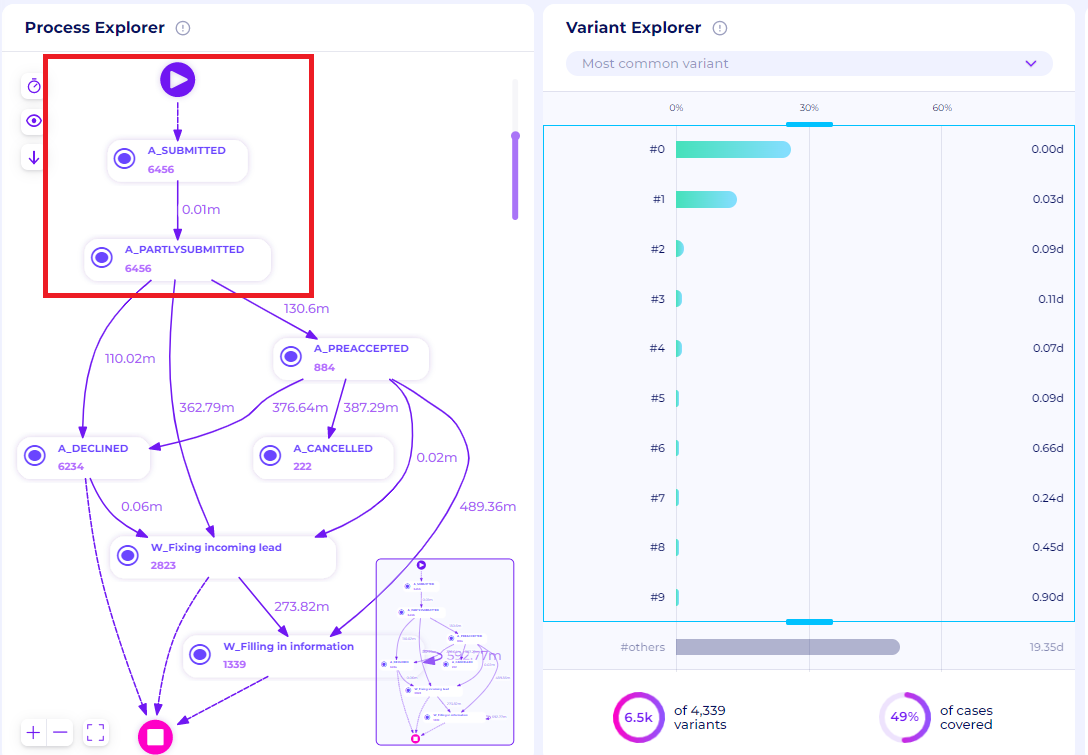
Figure 28. Throughput time between all activities in the top 10 variants
Another way to do analysis in the variant explorer is to combine multiple filters that Percetif has. For example, let’s check all the possible variants where the cases passed the A_Approved activity. To do that, we can use the activity selection filters once again, select the Case flow through option, and select the A_Approved activity.
Figure 29. Retain all approved cases
When we check the variant explorer, we can see that there are a lot of variants (2068), where each variant has very few cases (around 1 - 2 cases). This means that this process is very uncontrolled. These activities are uncontrolled in that they could be carried out again in any order or not at all up until a condition. We also see there’s still a lot of manual human involvement in the process, shown by activity with the “W_“prefix. To solve this issue, the organization might want to establish what’s the ideal variant for the application process. That is usually a separate project and will not be covered in this demo. What this shows us is the reality of the process and is a good starting point for improvement.
Video 1. Uncontrolled variants of the approved loan applications
Another type of analysis we can do is to check cases that have the longest throughput time and see what activities extend the process. To do that, we can go back to the discovery tab, and retain cases with the longest throughput time
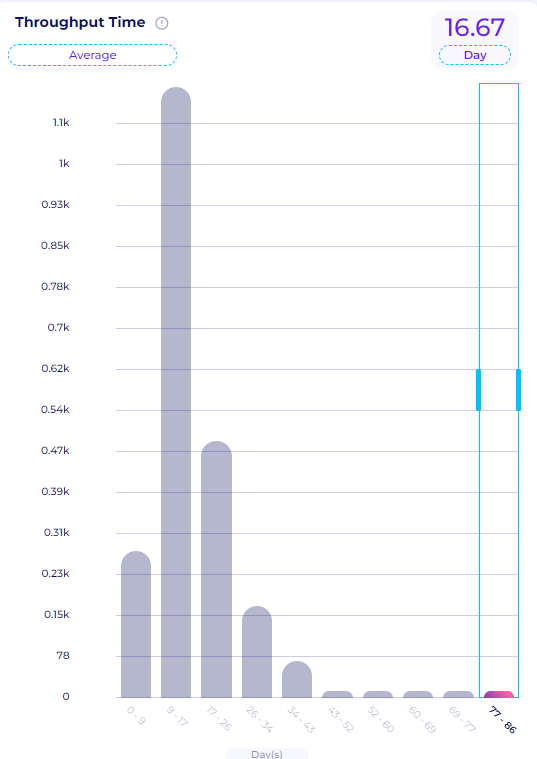
Figure 30. Throughput Time Window
We can check the process explorer and identify activities with the longest throughput time. As expected, activities that are manually done by a human (the one with the “W_“ prefix) extend the case the longest. For example, between W_Filling in information and W_ Calling After Sent offers, there’s a week of waiting time. There are also a lot of repeated activities such as for W_Calling After sent offers, and W_Calling to add missing information that extends the case up to several days and are bottlenecks. Ideally, manual tasks should be minimized as much as possible by automation. This process flow provides insight into which activity that should be automated.
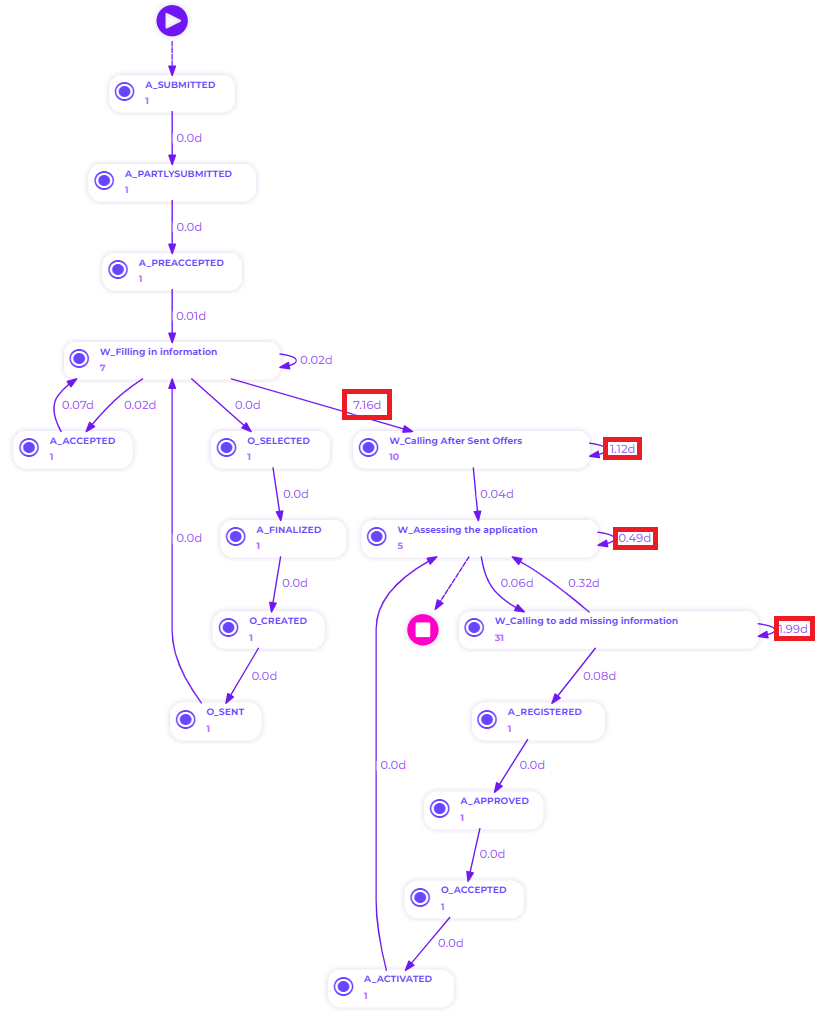
Figure 31. Activities with the longest waiting time in approved cases
Now let’s check for cases that passed through A_Declined activity with the activity selection filters once again. Based on our analysis previously, declined cases are the most common types of applications. Again same as the previous, the A_SUBMITTED and A_PARTLYSUBMITTED are redundant activities. We also see a lot of W_Fixing incoming lead, which is triggered if the client didn’t fill in all the required information. This is definitely also a sign of inefficiency. We also see scenarios where the application is declined, but the activity W_Filling in information is still done. This is because the application is previously pre-accepted (A_PREACCEPTED) and we know that every pre-accepted application will trigger the W_Filling in information activity. The bank definitely needs to recheck the rule on how the declined cases are handled. This data provide us a good insight into the quality of the events handling.
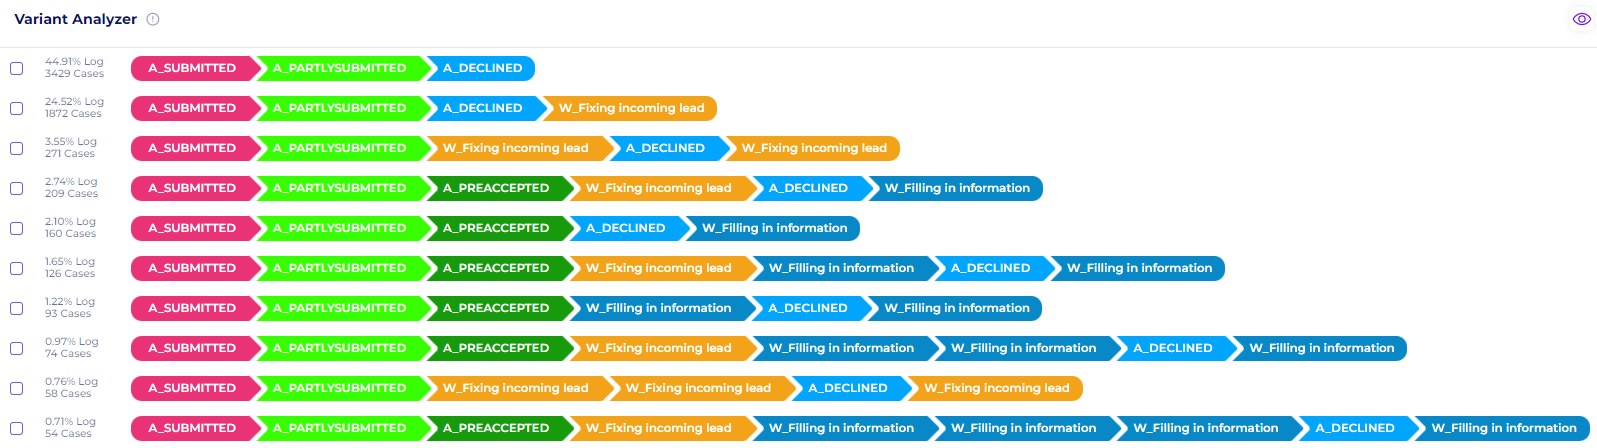
Figure 32. Top 10 variants of declined loan applications
Throughput time analysis on the longest cases also showed a similar result as the previous category of application, where manual tasks such as W_ Calling After Sent offers and W_Calling to add missing information are the main cause of the long case duration. We also see multiple repeated activities.
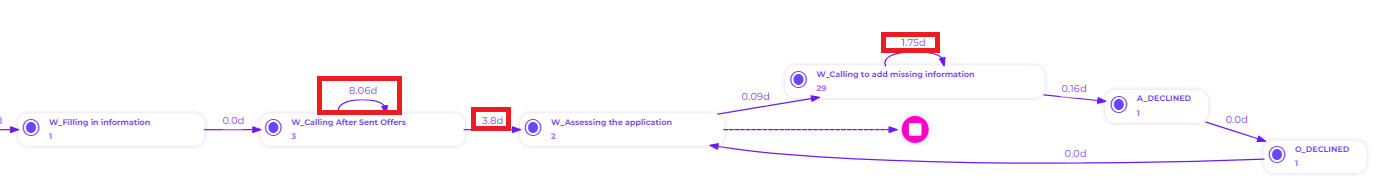
Figure 33. Activities with the longest waiting time in declined cases
Finally, let’s check for cases that passed through A_Cancelled activity with the activity selection filters once again. In this type, we see in the top 10 variants, that all canceled cases have already been pre-accepted, but then canceled either by the client or the bank. We also see a lot of the activity W_Filling in information that is done after the application is canceled, for the same reason as the previous category. The bank needs to recheck again their rules on canceled cases.
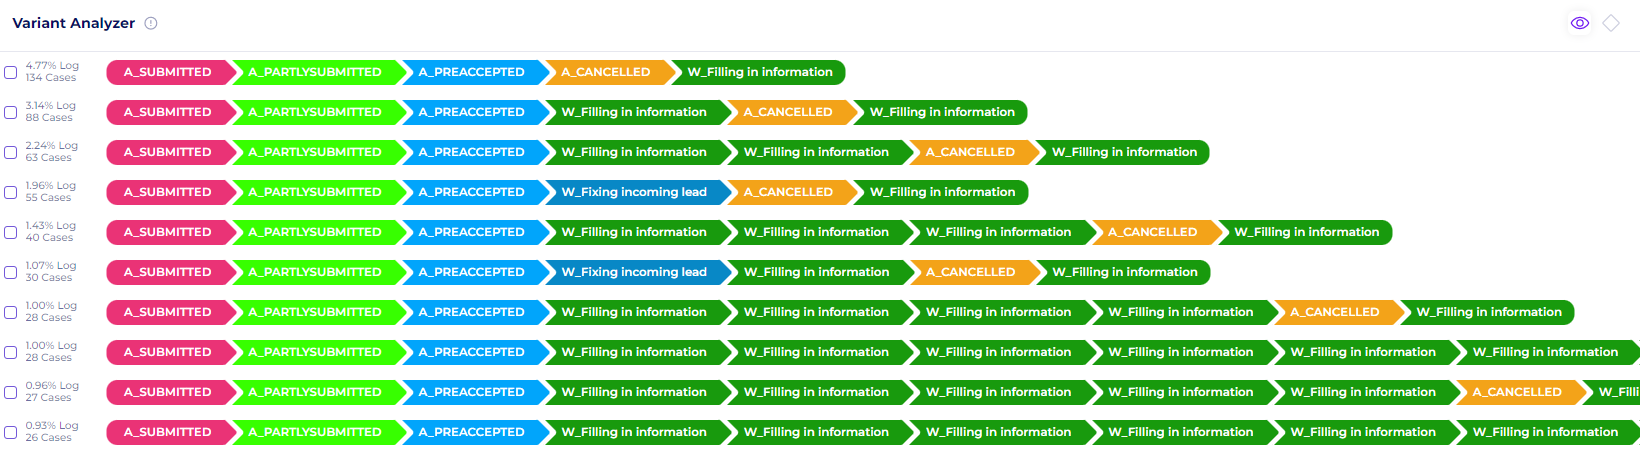
Figure 34. Top 10 variants of canceled loan applications
Are there applications that get lost in the middle, applications that never get resolved (Approved, declined, or canceled)?
We can check cases that are neither declined, approved, or canceled with the activity selection filters.
To do that, we can open the activity selection filters, and select the Case does not follow through option. Select the A_Approved activity and then confirm the selection. After that, click the activity selection filters once again, and select the A_Declined activity for Case does not follow through option. Confirm the selection again, and do it once again for the A_Cancelled activity. Perceptif allows stacking filters on top of each other for analysis
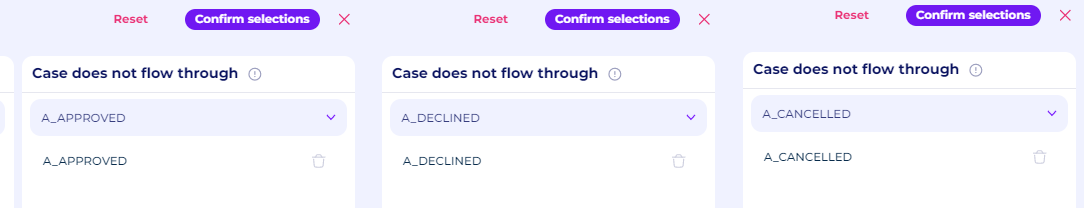
Figure 35. Stacking multiple activity selection filters
To see how many cases are neither approved, declined, nor canceled, we can select all the variants. We can call this category the “undecided“ category. We see that there are around 399 cases of undecided loan applications.
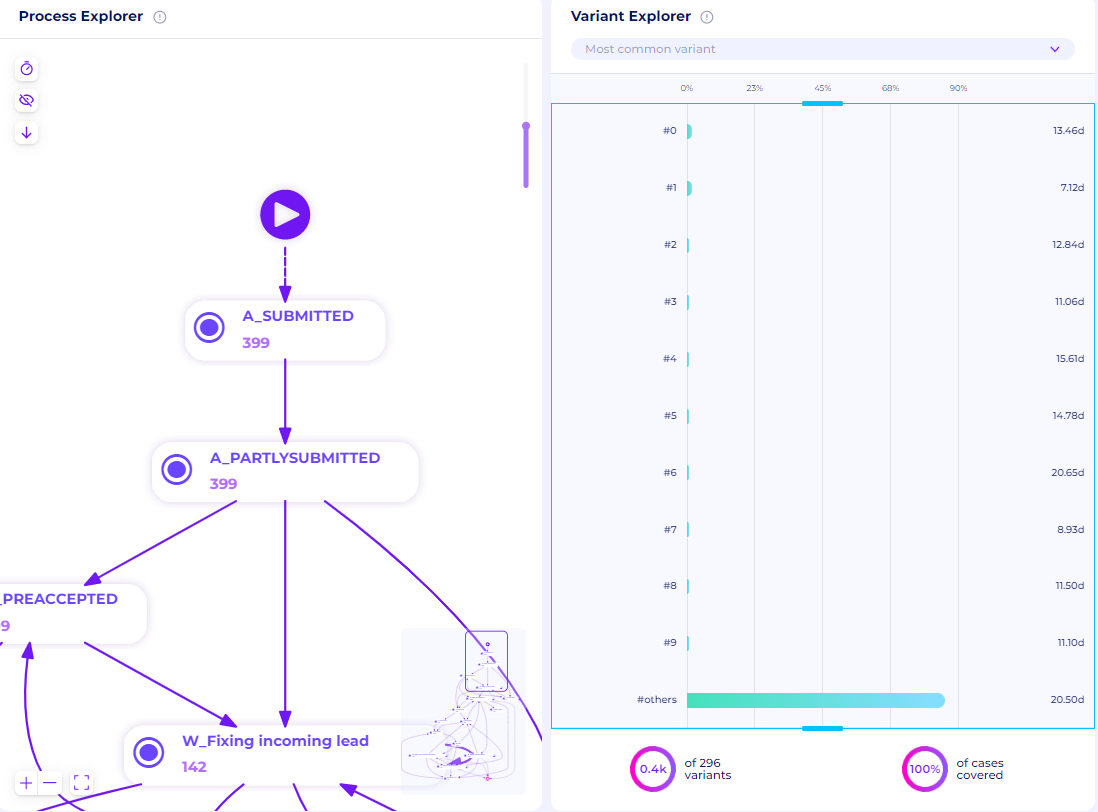
Figure 36. All variants of “undecided“ cases
One of the analyses that can be done on the undecided category is to check cases with the longest case duration. This is definitely unideal since cases that are still undecided and have a really long case duration usually mean that cases have either been forgotten or “lost“. We can retain cases that took 34 - 67 days and select all the variants. We can see that there are 27 cases with 27 different variations that have a really long case duration and are still undecided.
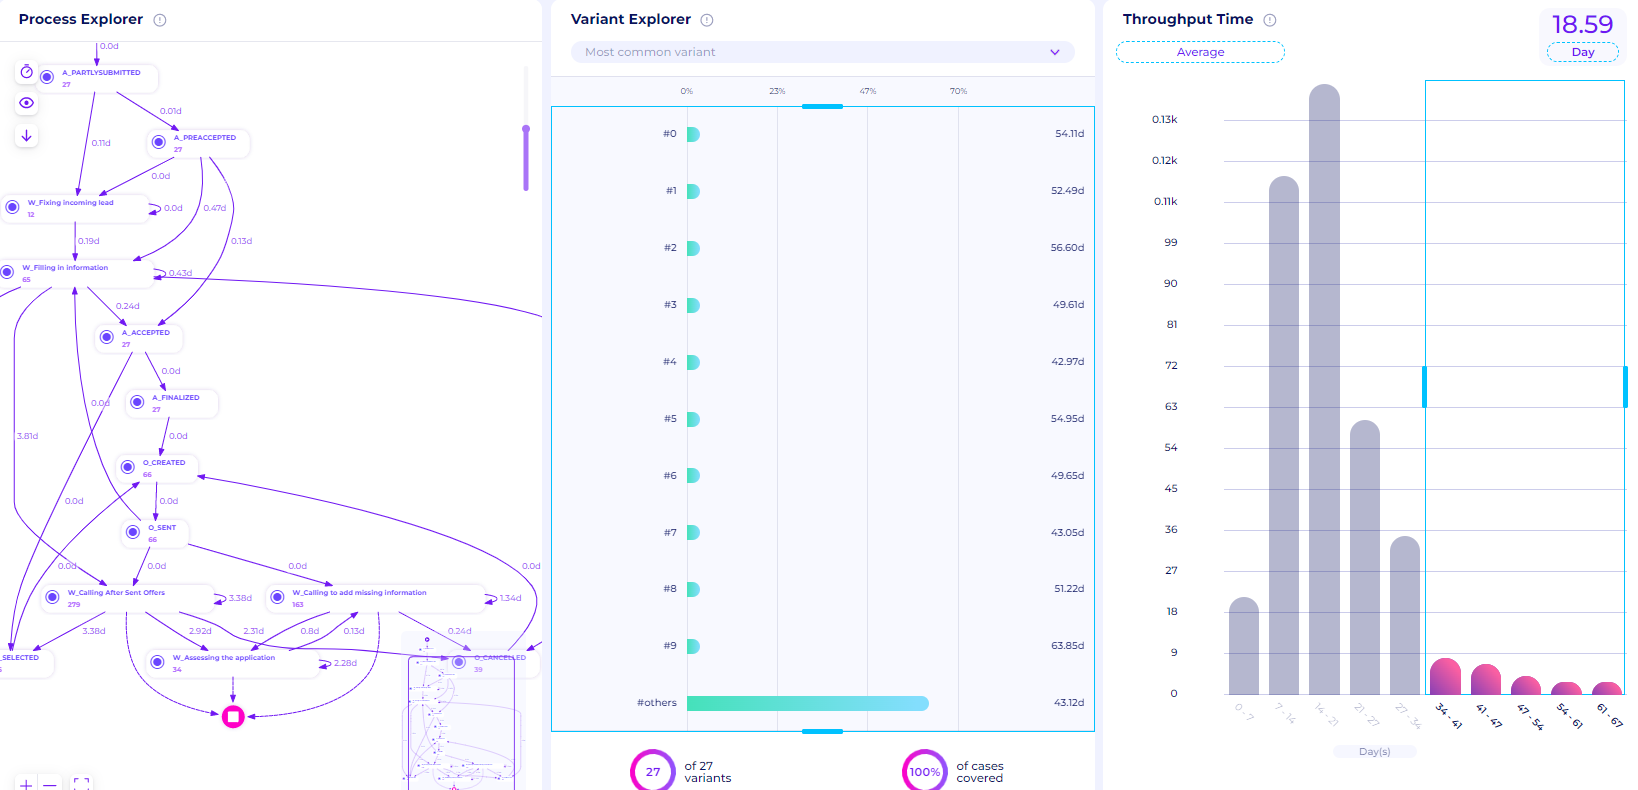
Figure 37. Undecided cases that have a really long case duration
If we focus on activities that are near the end event, we can see there are three activities that are done before the cases just stop. Those activities are W_Calling After Sent Offers, W_Assessing the application, and W_Calling to add missing information. The bank needs to pay more attention to these activities and set up a proper follow-up for these undecided cases.
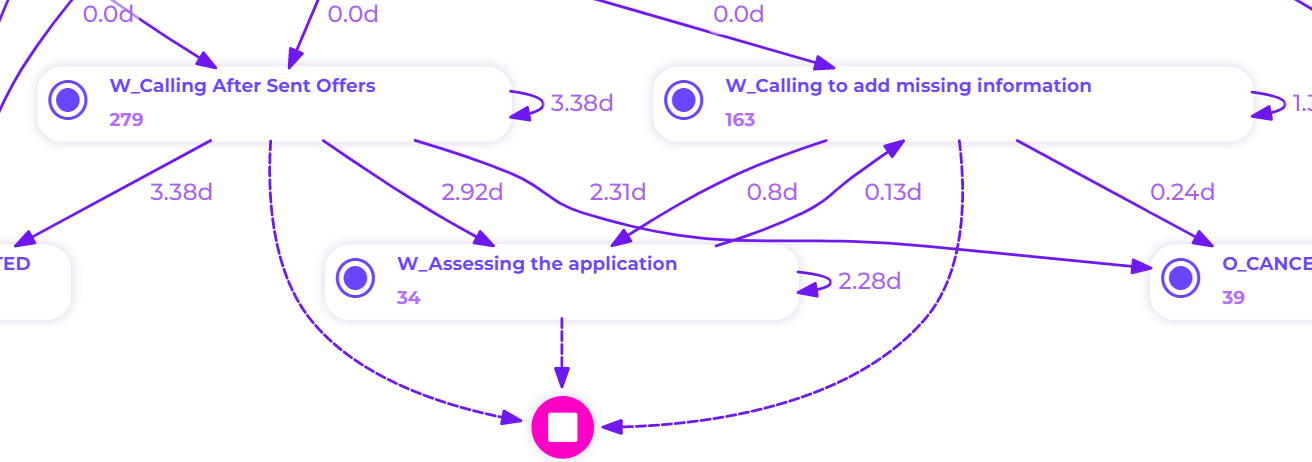
Figure 38. Detail on the undecided activities with a really long case duration
Create BPMN Model
After figuring out the actual model found in the dataset, we can create a business process model and notation (BPMN) to represent the process maps. This BPMN model can be integrated later as a part of the dashboard/visualization and conformance.
Select the process canvas option after clicking the new tab icon
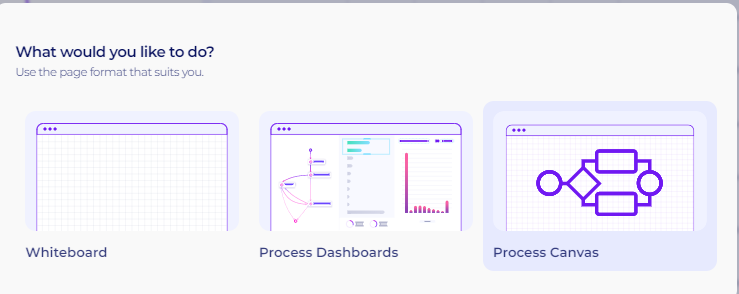
Figure 39. Process Canvas Options
A new tab will open with three options. Users can create new diagrams, select from previously uploaded diagrams, or upload from PC. Since we’re going to create a new diagram from scratch, select the first option
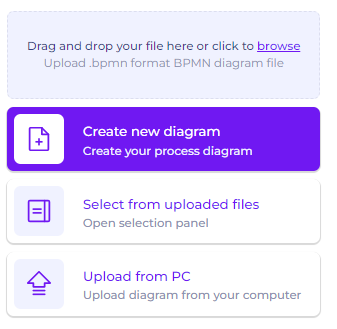
Figure 40. BPMN tab options
A new blank page will be shown in the tab. To start editing, click the edit button at the bottom left of the page

Figure 41. Edit Button in the BPMN tab
The BPMN tools will be available and can be used directly. The following video is an example of drawing the most common variant for the declined applications
Video 2. Create a BPMN model of the most common variant of the declined cases
Insights and Possible Improvements
From the analysis of the loan applications dataset, we can gain several insights and possible improvements to streamline the process, as follows.
Based on the data, there are only 17% of cases where the loan is approved. 21% of all applications are canceled and 58% of them are declined. A small percentage of the application cases are still undecided. This shows massive inefficiency for the bank/financial institutions since the bank will only get revenue from the interest of an accepted loan
In all variants, the activity A_SUBMITTED is always followed by A_PARTLYSUBMITTED. This demonstrates redundancy and may help drive up operational costs, which would then lead to a drop in output and efficiency. If possible, the bank should remove one of the activities or automate it.
For applications that are approved, we can see that there are a lot of variants (2068). This means that this process is very uncontrolled. These activities are uncontrolled in that they could be carried out again in any order or not at all up until a condition. The organization might want to establish what’s the ideal variant for the loan application process.
We also see there’s still a lot of manual human involvement in the process, shown by activity with the “W_“prefix. These activities are usually the main cause of uncontrolled processes since it is usually done case by case. The bank/organization should try to minimize human involvement as much as possible to increase efficiency and process controls.
Activities such as W_Filling in information, W_ Calling After Sent offers, and W_Calling to add missing information are usually the activities that extend the case duration. Again, these activities are the one that is done manually and need to be evaluated and should be automated if possible.
We also see scenarios where the application is declined/cancelled, but the activity W_Filling in information is still done. This is because the application is previously pre-accepted (A_PREACCEPTED) and we know that every pre-accepted application will trigger the W_Filling in information activity. The bank definitely needs to recheck the rule on how the declined cases are handled.
For undecided cases with very long case duration, activities such as W_Calling After Sent Offers, W_Assessing the application, and W_Calling to add missing information are usually left behind without any follow-up. The bank needs to recheck these cases and pay attention on their follow-up rules.
All the insights and possibilities for improving the process above can be obtained easily through Perceptif and all the available features. Perceptif easily helps business analysts get these insights without having to create custom formulas or perform special queries.